
How Much Revenue Can a Vending Machine Business Make?
A practical U.S. planning guide for how much revenue can a vending machine business make?, built for founders, buyers, and operators comparing assumptions before committing capital.

How much revenue can a vending machine business make in practice?
A vending machine business can produce anything from modest route income to a scalable operating business, but the real answer depends on machine count, location quality, product mix, and how efficiently the route is run. For most buyers and founders, the key question is not just gross sales per machine; it is whether those sales can support commissions, inventory, repairs, mileage, software, and owner time after the route is built.
If you are evaluating a startup, acquisition, or funded launch, treat revenue as a planning assumption that must be tied to local location terms and current operating inputs. A route that looks attractive on paper can perform very differently once lease terms, refill frequency, spoilage, and service calls are included.
| What the reader is deciding | What must be verified locally |
|---|---|
| Whether the vending business can generate enough revenue to justify the route, equipment, and working capital | Location traffic, machine placement terms, commissions, product pricing, refill cadence, and route density |
- Lease / location terms: site access, commission expectations, and any placement restrictions
- Equipment: machine price, age, reliability, and service history
- Labor: owner time, driver help, stocking frequency, and maintenance time
- Menu economics: product mix, margin by item, spoilage, and price sensitivity
- Permits / local requirements: any local rules that affect placement or operations
- Working capital: cash needed for inventory, repairs, and slow ramp periods
- Funding readiness: whether the numbers are organized enough for a lender, partner, or buyer conversation
With those assumptions in view, the next step is to separate the revenue question from the operating math and build a practical framework for what should be measured first.
Which assumptions actually drive vending machine revenue and route economics?
For a vending business, the revenue answer is less about a single average and more about the inputs that shape each machine’s sales, service cost, and gross margin. The practical goal is to document those inputs before you buy machines, sign placements, or build a funding case.
What should you verify before you estimate route revenue?
| Planning area | Question to answer | Input to collect | Model impact | Verification source |
|---|---|---|---|---|
| Location quality | How much foot traffic and purchase intent does each site have? | Site type, visitor count pattern, dwell time, competing food options | Drives projected sales per machine | Site walk-throughs, operator interviews, landlord or manager feedback |
| Machine mix | What products can the machine sell at that location? | Snack, beverage, combo, cold food, specialty machine type | Changes average transaction value and product turnover | Supplier specs, comparable route observations, placement history |
| Price and product mix | What will customers actually buy at that site? | Planned item mix, retail prices, package sizes | Determines gross sales and margin per vend | Competitor checks, local customer demand, test placement data |
| Placement terms | Will the site require commission, rent, or another revenue share? | Percentage share, fixed rent, exclusivity, term length | Reduces net revenue available to the route | Draft placement agreement, landlord terms, operator benchmark calls |
| Service cadence | How often will the machine need stocking and maintenance? | Visit frequency, fill time, routing sequence, emergency service needs | Raises labor, fuel, and route mileage cost | Route test runs, travel logs, operator time study |
| Payment method mix | How much sales volume will move through cashless systems? | Cash vs. card mix, processing fees, telemetry subscription | Impacts net margin and reporting visibility | Equipment vendor terms, merchant statements, software quotes |
| Loss and spoilage | How much product will expire, be damaged, or disappear? | Shelf life, shrink assumptions, spoilage reserve | Reduces realized margin and inventory efficiency | Inventory counts, past route records, product rotation plan |
| Repair and downtime | What reserve is needed for repairs, parts, and missed sales? | Maintenance frequency, parts budget, downtime allowance | Separates gross sales from durable owner earnings | Technician quotes, machine age, service history, warranty terms |
How should a founder build documented assumptions for a vending route?
- List every proposed machine by location, type, and expected service cadence.
- Record site-specific sales drivers: traffic pattern, customer profile, nearby food options, and operating hours.
- Collect placement terms in writing, including any commission, fixed rent, exclusivity, or utility responsibility.
- Estimate per-machine sales using comparable locations or a short test period, not a generic portfolio average.
- Define the product mix and retail price plan for each machine so margin assumptions match the site.
- Estimate route labor, mileage, and restocking time by route cluster rather than by the whole business.
- Add operating reserves for spoilage, maintenance, cashless fees, software, and replacement parts.
- Document each assumption with a source so the model can be reviewed, challenged, and updated later.
What should you treat as route-unit-economics inputs, not guesses?
In vending, small differences in sales density or service frequency can change the whole economics of a route. The planning job is to turn those differences into tracked inputs: machine-level sales, route mileage, vend mix, commission terms, fill labor, and reserve spending. That gives you a cleaner view of revenue potential and whether a route can support debt, replacement equipment, and owner pay.
What do the revenue assumptions mean for margin and break-even?
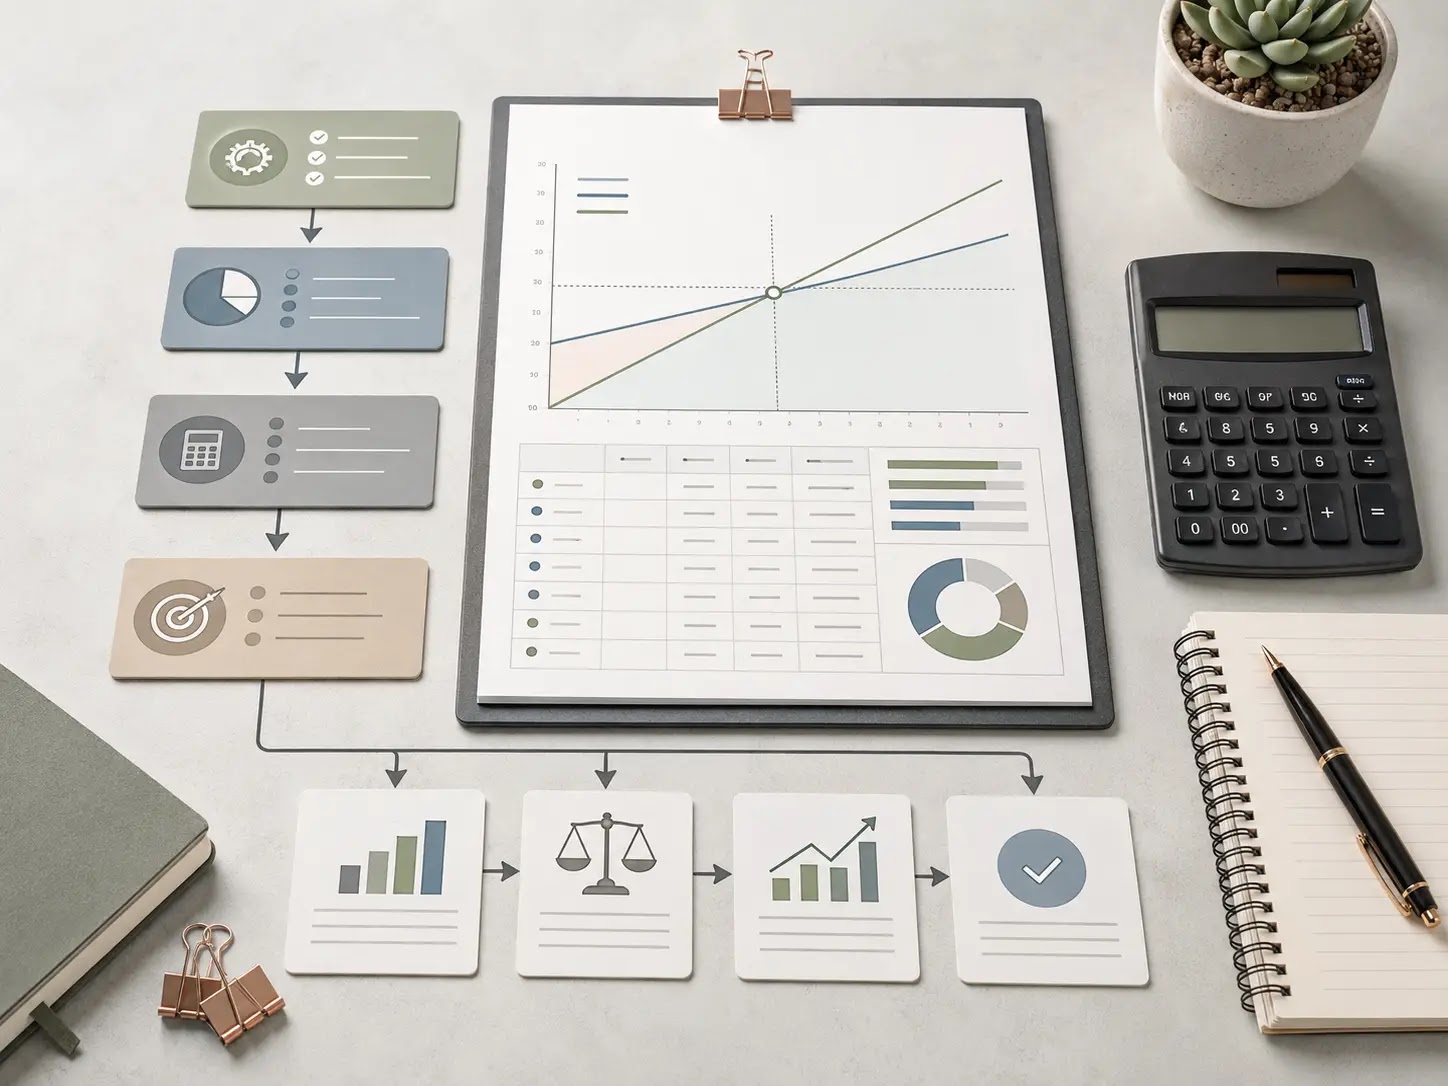
For a vending machine business, the headline revenue number is only part of the picture. The practical model depends on machine count, sales per machine, product mix, route mileage, commissions to location owners, payment fees, repairs, and how much owner labor is needed to keep machines stocked and working. A route can produce solid gross sales and still feel cash-tight if commissions, service trips, and inventory turns are heavy.
Use the planning lens below to translate revenue into cash flow. Treat every default as an illustrative placeholder only and replace it with current local quotes, vendor terms, and verified operating data.
Quick assumption check
- How many machines will be active in the model?
- What is the expected average sales per machine per month?
- Which locations require commissions, rent, or revenue share?
- How often will you travel, restock, and service machines?
- What percentage of sales will go to inventory, payment fees, and repairs?
Where the model usually breaks
- Traffic assumptions are stronger than actual buying behavior.
- High-commission locations leave too little gross margin.
- Route density is too low, so labor and fuel absorb cash flow.
- Repair downtime reduces sales before the owner notices.
- Working capital is not large enough to cover inventory and slow months.
Calculator-style planning inputs
| Planning item | What to enter | Formula or use | Why it matters |
|---|---|---|---|
| Machines in service | Active machines you expect to operate | Machines × sales per machine | Sets the top line before costs |
| Average sales per machine | Your estimate by location type | Use monthly or weekly, then standardize | Drives revenue and replenishment frequency |
| Product cost | Current wholesale inventory cost | Revenue − product cost = gross profit | Shows how much cash remains after stock |
| Location commission or rent | Any revenue share, flat fee, or placement term | Subtract from gross profit | Can materially change route margin |
| Route labor and mileage | Drive time, stocking time, fuel, and helper pay | Subtract from operating cash flow | Often the biggest difference between paper and reality |
| Repairs, software, and fees | Card processing, telemetry, maintenance, and subscriptions | Include as recurring overhead | Protects the model from overstating profit |
| Working capital | Cash reserved for inventory and slow collections | Runway months = cash ÷ monthly burn | Important for funding readiness |
Simple break-even and runway calculator
| Input | Placeholder | How to use it |
|---|---|---|
| Average monthly sales per machine | Replace with your market estimate | Total monthly revenue = machines × sales per machine |
| Gross margin after product cost | Enter your margin assumption | Gross profit = revenue × gross margin |
| Monthly fixed costs | Labor, fuel, software, insurance, storage, loan payment | Break-even revenue = fixed costs ÷ gross margin after variable costs |
| Startup cash needed | Machines, initial inventory, buildout, deposits, launch marketing | Funding need = startup cost + opening working capital |
| Cash runway | Available cash reserve | Runway months = cash reserve ÷ monthly cash burn |
Interpretation: if a route has strong revenue but weak contribution margin after commissions, servicing, and inventory cost, it may still need more capital before it becomes self-funding.
Scenario tradeoffs to test before you buy or scale
| Scenario | What improves | What usually worsens | Planning question |
|---|---|---|---|
| High-traffic locations | Revenue per machine | Commission pressure, stocking frequency | Does higher sales outweigh the added site cost? |
| Dense route cluster | Labor efficiency and mileage | Location concentration risk | Can one service trip cover enough machines to matter? |
| Card-heavy payment mix | Potential sales conversion | Processing fees and device costs | Do higher sales cover payment and telemetry expense? |
| Older machine mix | Lower upfront purchase cost | Repair risk and downtime | Will maintenance erase the purchase discount? |
Verify locally before you underwrite the route. Machine income, commissions, landlord terms, utility access, card-processing fees, insurance requirements, permits, tax treatment, and vendor contracts vary by market and should be checked with current local sources and written quotes. Replace placeholder assumptions with verified data before you rely on the model for funding, acquisition, or lease decisions.
Practical takeaway: the revenue answer becomes useful only when it is converted into break-even sales, cash runway, and labor coverage. That is the level lenders, partners, and buyers usually want to see in a pitch deck or planning model.
What should a vending machine founder or buyer do next?
Practical recap: vending machine revenue is driven less by the machine itself and more by route quality, machine count, traffic, product mix, commissions, mileage, downtime, and how much working capital you have to keep inventory and repairs moving. The right question is not just “how much can it make?” but “which locations, operating costs, and sales assumptions make the route viable in my market?”
Next-step checklist
- Confirm your expected machine count, location mix, and route geography.
- Estimate sales per machine using conservative, location-specific assumptions.
- Document inventory cost, commissions, fuel, repairs, software, and servicing time.
- Stress test break-even performance under slower sales and higher downtime.
- Check whether the business can support debt service, lease obligations, and replenishment timing.
- Verify local vendor terms, landlord requirements, and any market-specific operating constraints.
- Decide whether you are buying an existing route or building from scratch, since the risk profile differs.
Readiness scorecard
| Decision check | Ready when... | If not yet ready |
|---|---|---|
| Location quality | You have a defensible list of sites and expected traffic patterns. | Keep prospecting before you finalize the model. |
| Unit economics | You can estimate gross sales, product cost, commissions, and servicing costs per machine. | Build a conservative per-machine assumption set first. |
| Working capital | You know how much cash is needed for inventory, repairs, and uneven sales periods. | Revisit funding size and timing. |
| Route efficiency | Your mileage, refill frequency, and labor time are mapped by route. | Redesign the route before scaling machine count. |
| Financing readiness | You have a clear use of funds and a supportable revenue case. | Organize the story before approaching lenders or partners. |
If you are turning this into a lender packet, acquisition screen, or launch plan, a business plan, financial model, pitch deck, checklist, and startup toolkit can help organize assumptions, compare scenarios, and document the plan for partners, landlords, lenders, or advisors.
Final takeaway: a vending machine business can be attractive, but the answer depends on disciplined assumptions. Start with location quality, then test sales, commissions, route efficiency, repairs, and working capital before you decide to buy, build, or scale.


