
Vending Machine Break-Even Analysis: Units, Sales, and Fixed Costs
A practical U.S. planning guide for vending machine break-even analysis: units, sales, and fixed costs, built for founders, buyers, and operators comparing assumptions before committing capital.

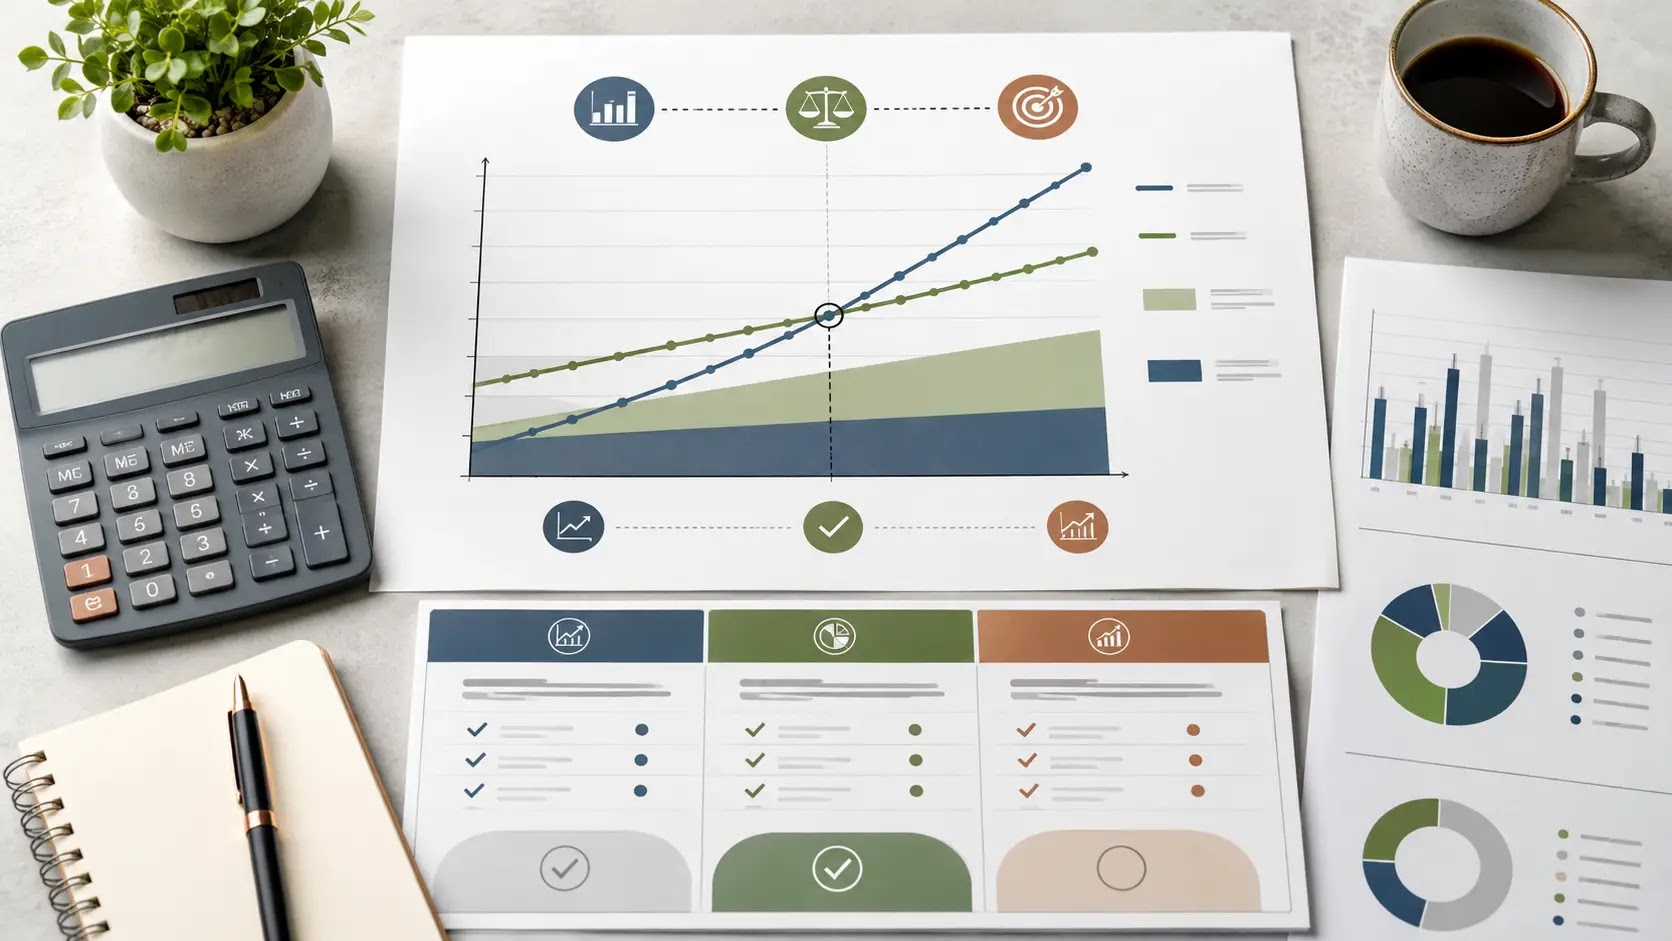
How do vending machine units, sales, and fixed costs determine break-even?
For a U.S. vending machine startup or acquisition, break-even is not a single industry number. It depends on how many machines you place, how often they sell, and whether each route can cover product cost, commissions, mileage, service time, repairs, software, and other fixed overhead.
The practical question is whether your expected location mix can produce enough gross profit to support the route after operating costs and any debt service. If you are buying a route, that question should be tested against actual location-level sales and vendor terms, not just top-line revenue claims.
| What the reader is deciding | What must be verified locally |
|---|---|
| How many machines or locations are needed to cover fixed costs | Actual sales per machine, stop frequency, and route density in your market |
| Whether a route or acquisition can earn enough after operating costs | Location commissions, product cost, spoilage, repairs, fuel, software, and labor inputs |
| Whether the plan is financeable and workable in practice | Lease terms, equipment pricing, working capital needs, and lender or seller conditions |
The biggest break-even assumption categories usually include lease or location fees, equipment and machine acquisition cost, labor or owner time, product mix and margins, permits and local operating requirements, working capital, and funding readiness if you are using debt or seller financing.
- Lease or placement terms and any location commission structure
- Machine purchase price, refurbishment needs, and repair reserves
- Route mileage, restocking labor, and service frequency
- Product mix, shrink, spoilage, and margin after inventory cost
- Permits, local operating requirements, and insurance expectations
- Working capital for inventory, cash float, and early operating months
- Funding readiness if the plan depends on debt, seller terms, or outside capital
The next step is to turn these assumptions into a practical planning framework so you can test break-even units and sales with local inputs instead of rough guesses.
How do you build a practical break-even framework for a vending machine route?
For a U.S. vending machine founder or buyer, the break-even question is not just “How much can one machine sell?” It is whether each placement can support product cost, commission or rent, route mileage, service time, repairs, payment processing, software, and enough working capital to keep the route stocked and functional. That means the model should be built from documented assumptions, not a single headline sales estimate.
What inputs actually drive break-even on a vending route?
The most useful framework starts with location-level economics, then rolls those numbers up to the route. Each machine can behave differently depending on foot traffic, placement terms, hours of access, and restock frequency, so the model should separate stable fixed costs from variable costs tied to sales or stops.
| Planning area | Question to answer | Input to collect | Model impact | Verification source |
|---|---|---|---|---|
| Machine count | How many working units are needed to support overhead? | Planned machines by location and phase of rollout | Determines total revenue capacity and how fixed costs are spread | Placement pipeline, purchase list, deployment schedule |
| Sales per machine | What does one machine realistically sell in a typical period? | Expected vend count or sales dollars per machine by location type | Drives gross revenue and replenishment needs | Historical route data, comparable placements, test period results |
| Product cost | What is the cost to buy the inventory being sold? | Wholesale cost by SKU or category | Affects gross margin and break-even sales volume | Vendor quotes, invoices, distributor catalogs |
| Placement terms | What does the location take in exchange for the space? | Commission, rent, or revenue share terms | Reduces net sales available to cover route overhead | Signed placement agreement, landlord or site operator terms |
| Route mileage and time | How much labor and travel does each stop require? | Miles, drive time, service time, and stop frequency | Impacts labor cost, fuel cost, and operator capacity per day | Route map, dispatch logs, driver records |
| Repairs and maintenance | What ongoing service cost should be reserved? | Expected repair frequency, parts, cleaning supplies, technician time | Reduces cash available for owner earnings and expansion | Past service history, vendor service terms, maintenance notes |
| Payment and software costs | What technology costs are tied to running and tracking the route? | Card processing fees, monitoring software, telemetry, route software | Raises recurring overhead and may change collection frequency | Vendor proposals, processor statements, software pricing pages |
| Working capital | How much cash is needed to stock and operate before collections catch up? | Inventory float, spare parts, cash reserve, and launch buffer | Affects funding need and early-stage survival | Startup budget, inventory plan, lender or investor model |
| Owner labor | Is the route a side business or a replacement-income business? | Hours spent stocking, servicing, purchasing, and managing the route | Changes owner earnings and break-even interpretation | Time study, staffing plan, operator schedule |
How should a founder move from research to documented assumptions?
Use a simple route-and-unit workflow so every assumption has a source and a reason. The goal is not perfection; it is a model that can survive a lender review, buyer diligence, or a real launch plan.
- Define the route structure. Separate planned machines by location type, service area, and launch phase so one strong location does not mask weaker units.
- Collect location-specific sales evidence. Use prior route performance, comparable placements, or a short test period to estimate sales per machine instead of using a single average for every stop.
- Document product margin by category. Track wholesale cost, expected mix, and spoilage or shrink assumptions for snacks, drinks, or other inventory.
- Capture site terms before forecasting revenue. Record commissions, rent, exclusivity, and any revenue share so the model reflects the actual placement economics.
- Estimate route operating cost. Add mileage, fuel, labor, maintenance, card processing, software, and collection expenses as recurring route costs.
- Separate fixed costs from variable costs. Keep office overhead, insurance, subscriptions, and vehicle or storage costs visible so you can see where break-even changes as the route grows.
- Build a working capital reserve. Include inventory float, change fund if needed, repair reserve, and cash for the first replenishment cycles.
- Test the weakest location first. Stress the model with lower sales, higher commissions, and more service time to see whether the route still covers overhead.
- Save the sources. Keep quotes, agreements, route logs, and supplier terms together so the assumptions can be reviewed later by partners, lenders, or buyers.
What should you verify before calling the break-even model usable?
- Each machine has a specific location assumption, not a generic route average.
- Sales inputs are tied to evidence from comparable placements or real test data.
- Commissions, rent, and vendor terms are written down and current.
- Route mileage and restock frequency are included, not treated as incidental.
- Repair, downtime, and inventory loss assumptions are visible in the model.
- Working capital is enough to cover stock, servicing, and early launch volatility.
With these assumptions documented, the next step is to translate them into break-even scenarios, downside cases, and owner-earnings tradeoffs in Block 3.
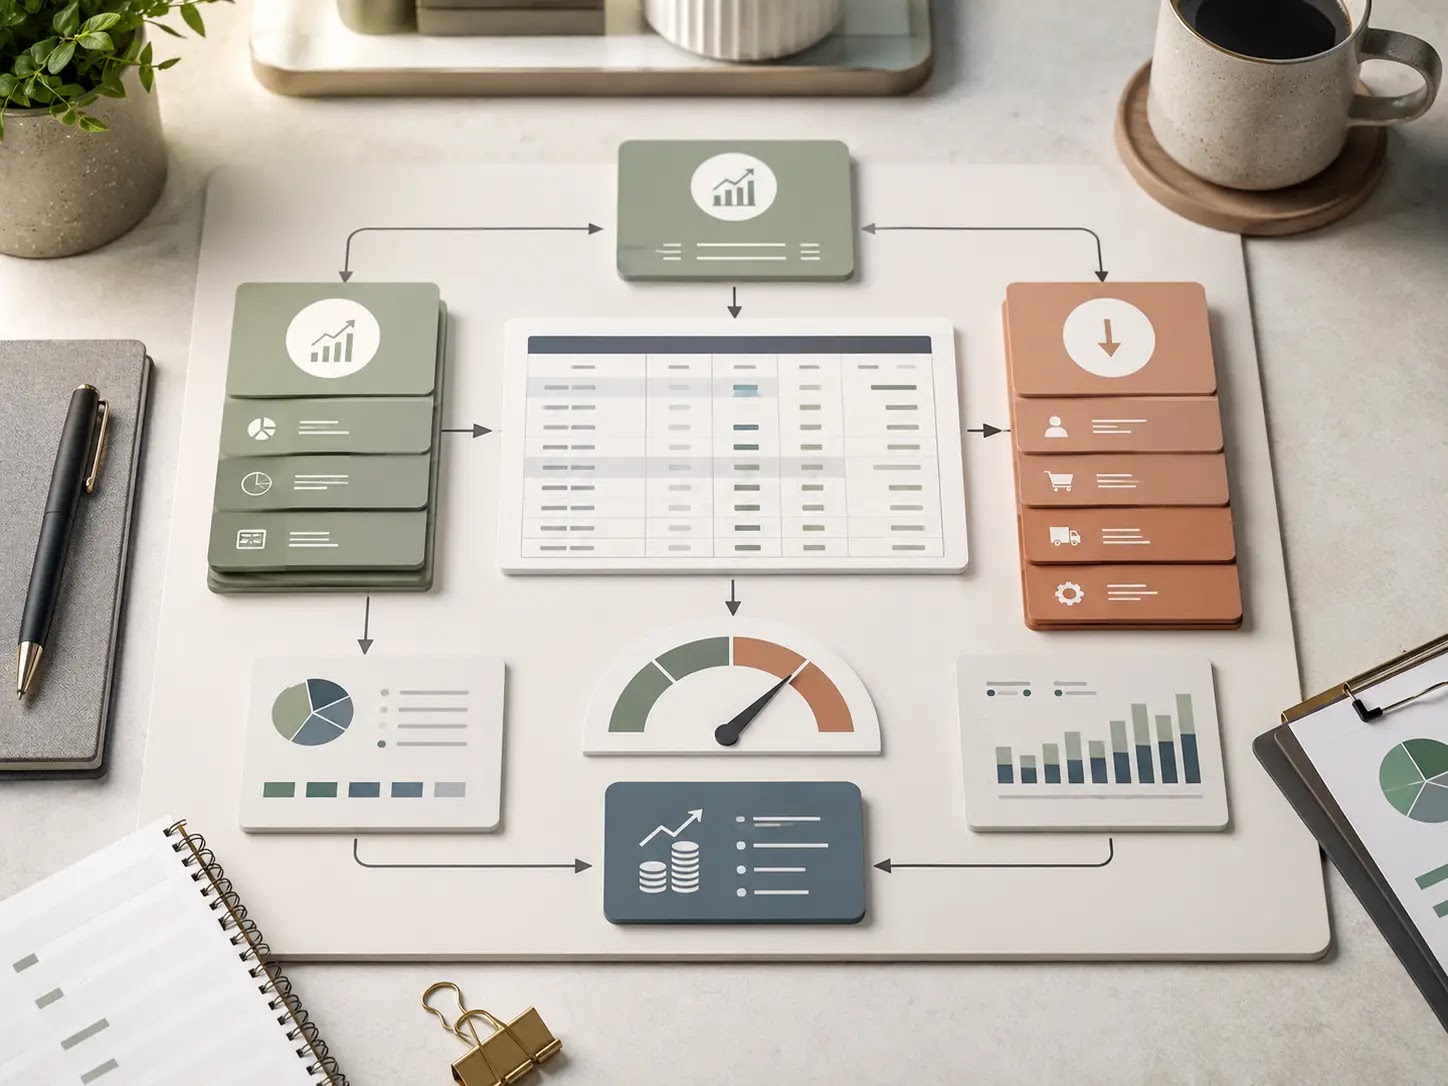
How do break-even assumptions change the answer for vending routes?
What is most sensitive in the model?
For a vending machine route, break-even usually moves fastest when you change average net vend per stop, location commissions, repair frequency, and labor coverage. If you count owner time as a real cost, the cash break-even point is often higher than the paper break-even point.
- Route mileage and service time can change labor and fuel burden.
- Inventory mix changes gross margin and shrink risk.
- Cashless fees and commissions reduce each sale’s contribution margin.
- Downtime and repairs can create revenue gaps without lowering fixed overhead.
- Working capital matters because inventory and service needs come before payback.
Break-even calculator: planning inputs to replace
| Metric | Simple planning formula | What to enter | Why it matters |
|---|---|---|---|
| Weighted average net vend | Σ(item share × net selling price) | Product mix by machine or location | Sets the sales base for contribution margin |
| Contribution margin per vend | Net vend price − product cost − variable fees | Supplier cost, card fees, location splits | Shows how much each sale helps cover fixed costs |
| Monthly fixed costs | Labor + rent/storage + software + admin + repair reserve | Route staffing, truck, insurance, service overhead | Core break-even driver for the route |
| Break-even sales | Fixed costs ÷ gross margin rate | Use the margin rate from your verified mix | Shows the monthly revenue target |
| Break-even units | Fixed costs ÷ contribution margin per vend | Sales per machine, per stop, or per route | Shows how much product must move |
| Cash runway | Cash on hand ÷ monthly cash burn | Opening cash, inventory, payroll timing | Shows how long the business can absorb misses |
| Funding need | Startup cost + working capital − committed cash | Machines, install, inventory, deposits, reserves | Helps size the funding request |
Scenario check: what changes the break-even result?
| Scenario | Assumption shift | Model effect |
|---|---|---|
| Lower-volume route | Fewer vends per machine, slower turns, more idle inventory | Break-even sales and units both rise |
| Base case | Verified traffic, stable service cadence, normal spoilage and repair reserve | Best estimate for lender, buyer, or founder planning |
| Higher-margin mix | Better product mix, lower commissions, stronger cashless acceptance | Break-even can fall even if volume is unchanged |
Treat owner labor as a real cost if you need the route to support payroll, debt service, or an owner draw. A route can look profitable before labor and still fail to cover full cash needs.
Local verification before you rely on the model
Warning: local rules, costs, vendor terms, lease terms, insurance requirements, financing conditions, and market prices vary by market. Replace placeholder assumptions with current quotes and verified data before using the break-even result for a lease, purchase, loan, or launch decision.
- Verify machine pricing, maintenance terms, and parts availability with current vendors.
- Confirm location commissions, placement fees, and any revenue-share terms in writing.
- Check current inventory pricing and delivery lead times from suppliers you can actually use.
- Validate route mileage, service time, and labor coverage with real stop counts.
- Recheck working capital needs after you size inventory, deposits, and opening repairs.
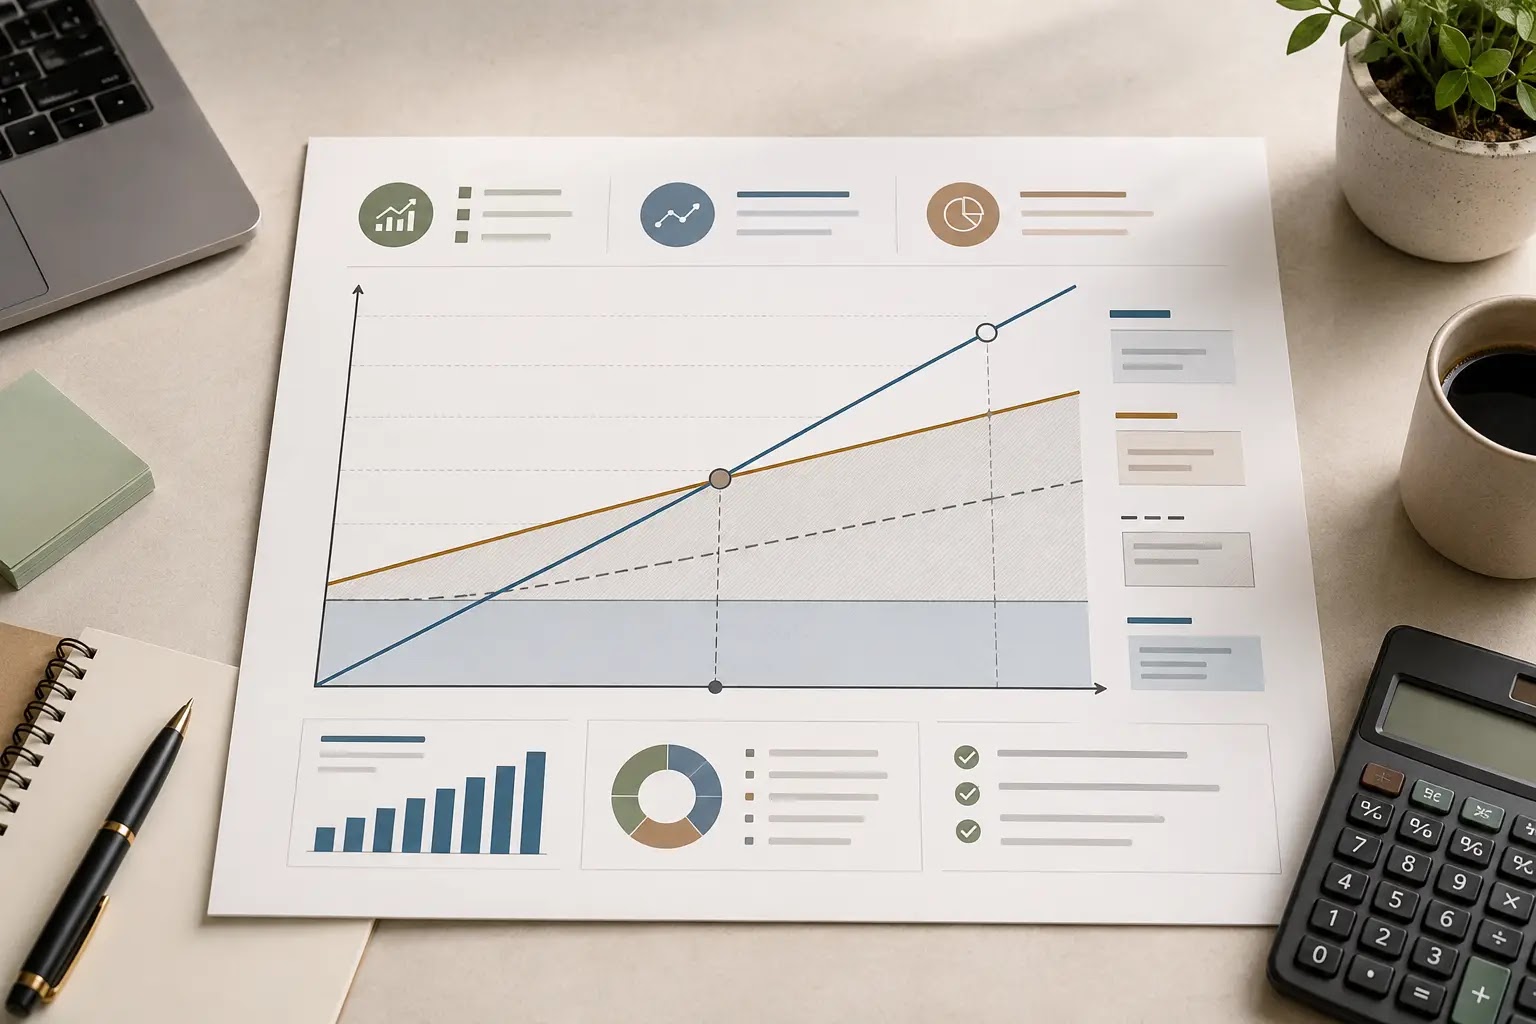
What should you verify before you move from break-even estimate to a real vending decision?
The practical takeaway is simple: a vending machine business becomes easier to judge when you test the same core assumptions from three angles—route density, machine-level sales, and fixed monthly costs. If the route still works after you include commissions, mileage, inventory, repairs, software, and working capital needs, then you have a usable planning case. If it does not, the model usually needs better locations, tighter costs, or more machines before it is ready for funding, buying, or launch.
For a U.S. founder or buyer, the best next step is not to guess at profitability, but to confirm the inputs that drive break-even and owner earnings in your own market.
Readiness scorecard: are you ready to act on the break-even analysis?
| Readiness item | What to confirm before proceeding |
|---|---|
| Machine count and route coverage | How many units you can realistically place, service, and monitor with the time and labor you have. |
| Location economics | Commission terms, access rules, customer traffic, and any site-specific expectations that affect sales. |
| Sales assumptions | Expected sales per machine based on location type, product mix, refill frequency, and local demand. |
| Fixed cost load | Software, insurance, storage, rent, vehicle costs, admin time, and any recurring vendor or service fees. |
| Repair and replacement reserve | Whether your plan includes enough cash for maintenance, downtime, and equipment replacement. |
| Working capital | Whether you can fund inventory, change, fuel, and early operating costs before cash flow stabilizes. |
Next planning steps
- Recheck your break-even math using the locations and machine count you can actually operate.
- Separate machine-level margins from route-level fixed costs so you can see where profit is created or lost.
- Stress test the model for slower sales, higher commissions, more repair time, or longer refill routes.
- Confirm vendor terms, machine pricing, and inventory assumptions with current quotes from your market.
- Decide whether the path is startup, acquisition, or expansion based on the strongest version of the numbers.
- Prepare a simple funding or owner summary that explains assumptions, risks, and working capital needs.
If you are turning this into a lender, partner, or landlord conversation, a business plan, financial model, pitch deck, checklist, and startup toolkit can help organize assumptions, compare scenarios, and document the plan clearly. Those materials do not replace local verification, but they do make the decision easier to review and revise.
Final takeaway: for a U.S. vending machine founder or buyer, break-even is only useful if it matches real routes, real commissions, real inventory turns, and real operating costs. Verify the local inputs, pressure-test the downside, and only then decide whether the business is ready to buy, fund, or launch.


