
Vending Machine Three-Year Forecast: Revenue, Costs, and Cash Flow
A practical U.S. planning guide for vending machine three-year forecast: revenue, costs, and cash flow, built for founders, buyers, and operators comparing assumptions before committing capital.


What does a three-year vending machine forecast usually come down to?
For a U.S. vending machine startup, acquisition, or route expansion, the three-year forecast is usually less about a single “best guess” revenue number and more about whether the route can support machines, inventory, repairs, commissions, mileage, and working capital over time.
The practical question is simple: can the location mix and product mix produce enough cash to cover operating costs while leaving room for replacements, downtime, and funding needs? That answer depends on local lease terms, placement fees, route density, sales per machine, and how often inventory must be replenished.
Before building the model, the reader should separate what can be estimated from what must be verified with current local sources. That keeps the forecast usable for a business plan, pitch deck, lender discussion, or acquisition review.
| What the reader is deciding | What must be verified locally |
|---|---|
| Whether the route can support a new launch, purchase, or expansion | Location traffic, placement terms, commissions, and route access |
| Whether the machine mix can cover operating costs over three years | Equipment prices, repair cadence, inventory costs, and refill frequency |
| Whether the plan is strong enough for funding or a pitch deck | Working capital needs, lender terms, and any market-specific requirements |
- Lease or placement terms: rent, commission, access rules, and any site-specific restrictions.
- Equipment: machine purchase price, refurbishment needs, age, and expected repair burden.
- Labor: owner operator time, servicing schedule, and any hired route help.
- Menu economics: product mix, margins, spoilage, pricing, and payment mix.
- Permits and site rules: requirements that vary by city, county, landlord, or property type.
- Working capital: cash for inventory, fuel, repairs, delays, and machine downtime.
- Funding readiness: how clearly the assumptions can be defended in a business plan or pitch deck.
With those items defined, the next step is to organize the local assumptions into a practical framework that can support revenue, cost, and cash flow planning.

What belongs in a three-year vending forecast framework?
A useful vending forecast is built from location-level assumptions, route economics, equipment costs, and working capital needs. For U.S. founders and buyers, the goal is not to guess a single “right” number; it is to document the inputs that drive revenue, cost of goods, service labor, commissions, and cash timing across year one through year three.
Planning inputs that change the forecast fastest
In vending, the biggest differences usually come from machine count, site quality, commission terms, restock frequency, repair burden, and how much driving is required to keep machines filled and operational. Those inputs should be verified before the model is treated as lender-ready or investor-ready.
| Planning area | Question to answer | Input to collect | Model impact | Verification source |
|---|---|---|---|---|
| Machine base | How many machines are operating in each year? | Planned machine count by month, plus any acquisition or rollout timing | Drives revenue scale, route workload, equipment spending, and fixed cost absorption | Purchase agreements, rollout schedule, placement pipeline, internal opening plan |
| Location mix | What types of sites will the machines serve? | Site type, expected traffic quality, hours of access, and service frequency needs | Changes sales velocity, restock cadence, and downtime risk | Site visits, placement notes, operator interviews, location owner discussions |
| Sales assumption | What does each machine sell in an average period? | Historical sales if acquired, pilot results if new, or documented estimates by location type | Primary driver of revenue and inventory demand | POS or telemetry reports, route logs, manual count records, seller history |
| Product mix and pricing | What products will be stocked and at what retail price points? | Category mix, pack sizes, retail pricing approach, and expected markdowns or promos | Changes gross margin, basket value, and replenishment frequency | Supplier quotes, competitor checks, machine planograms, sales history |
| Commission or site payment | What does the location receive for hosting the machine? | Commission terms, flat site fee, revenue share method, and timing of payment | Affects gross margin and monthly cash outflow | Signed placement agreement, draft terms, site owner confirmation |
| Route mileage and labor | How much driving and labor are needed to service the route? | Estimated miles, service stops, restock time, and whether labor is owner-run or hired | Drives fuel, vehicle, payroll, and route efficiency assumptions | Route map, service schedule, payroll plan, mileage log from comparable routes |
| Inventory cost | What does it cost to buy the inventory sold? | Supplier pricing, freight or delivery charges, minimum orders, and reorder timing | Sets cost of goods sold and inventory cash needs | Vendor quotes, invoices, wholesaler catalogs, distributor terms |
| Repair and maintenance | What service and repair burden should be expected? | Parts budget, technician costs if outsourced, preventive maintenance schedule | Impacts operating expenses, downtime, and replacement reserves | Service records, parts pricing, technician estimates, machine age and condition |
| Payments and software | What systems are needed for cash handling and telemetry? | Card reader fees, software subscriptions, payment processing terms, cash-count workflow | Changes monthly overhead and collections timing | Vendor proposals, processor agreements, software pricing sheets |
| Capex and replacements | What must be spent upfront and what will need replacement later? | Purchase price, refurbishment costs, delivery/setup, and replacement reserve policy | Determines startup funding need and future capital planning | Seller quotes, dealer invoices, refurbisher estimates, equipment condition review |
| Working capital | How much cash is needed to bridge early months? | Cash reserve target for inventory, repairs, commissions, fuel, and delayed sales ramp | Protects liquidity during slow ramp or route interruptions | Monthly cash-flow draft, lender requirements, owner reserve policy |
How to move from research to documented assumptions
- Map the route structure first. Separate existing machines, new placements, and any acquisition targets so the forecast reflects when revenue actually begins.
- Collect site-level facts. Record location type, access hours, expected traffic quality, commission terms, and service expectations for each machine or cluster.
- Pull sales evidence. Use historical sales from a seller, telemetry, cash logs, or pilot data; if none exist, document the basis for each estimate and label it clearly as an assumption.
- Build the cost stack. Separate inventory cost, commissions, fuel, labor, repairs, payment processing, software, insurance, and replacement reserves so gross margin and operating margin are visible.
- Test route economics. Compare revenue per stop, miles per stop, and service frequency to see whether the route can scale without overloading labor or cash.
- Document vendor terms. Keep supplier quotes, commission agreements, equipment estimates, and software proposals in one place so the forecast can be reviewed by a lender, buyer, landlord, or advisor.
- Set working capital assumptions. Add room for inventory buys, delayed collections, repairs, and slower-than-expected placement timing.
- Mark every assumption by source and date. That makes the model easier to defend in a pitch deck, acquisition memo, or funding package.
Verification note: For vending, local market terms and vendor pricing can vary materially. Current machine prices, commission practices, software fees, vehicle costs, and placement conditions should be checked with up-to-date local sources before you finalize the forecast.
Next, use these documented inputs in Block 3 to translate them into revenue, cost, and cash-flow implications, including the key tradeoffs and downside risk checks.
What should the three-year forecast stress-test?
Forecast lens
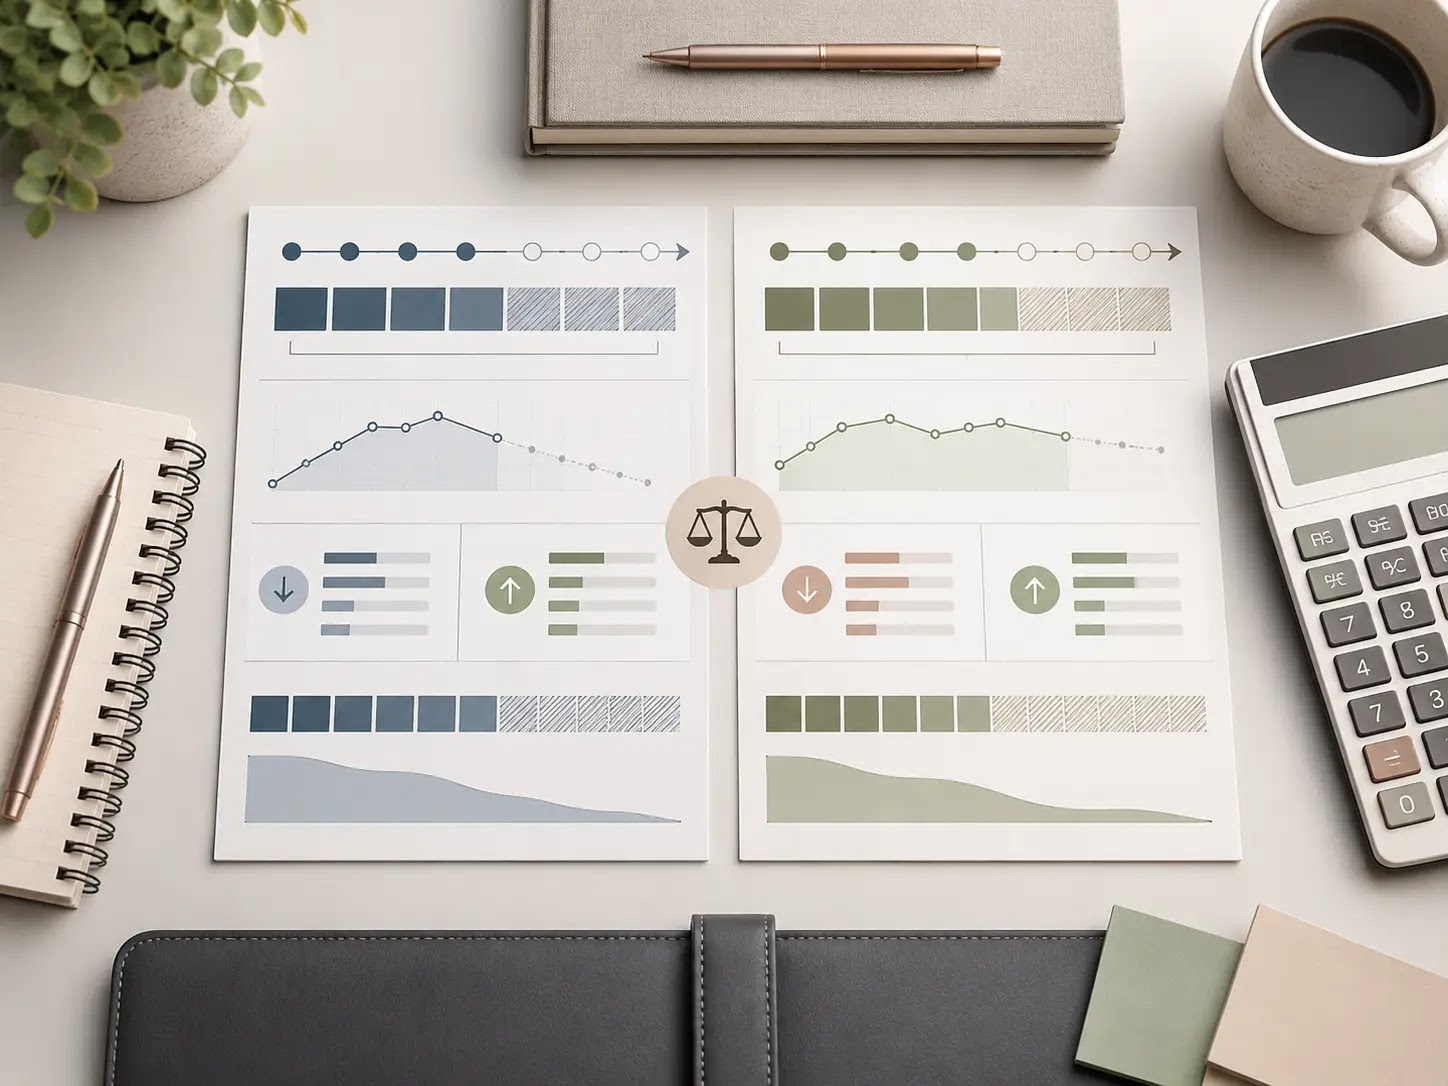
A usable vending forecast should show whether each route can pay for inventory, commissions, route mileage, repairs, software, and any debt service after the startup phase. The main question is not just revenue growth; it is whether cash stays available for restocks, downtime, and expansion without creating a working-capital crunch.
Tradeoff to watch
Higher-traffic placements can improve sales, but they may also bring tougher site terms, higher commission pressure, more frequent service visits, or faster product turnover. A larger machine count can spread overhead, yet it also increases upfront cash needs, repair exposure, and inventory tied up in the first fill.
Assumptions that move the model
- Average sales per machine by location type, daypart, and season.
- Payment mix, since card acceptance can change fee load and cash handling.
- Commission or placement terms set by the site owner or landlord.
- Route mileage, service time, and the number of machines per stop.
- Repair frequency, machine downtime, and software or telemetry fees.
- Initial inventory depth and refill cadence.
- Labor coverage: owner-operated, part-time help, or route technician support.
Risks that can break cash flow
- Sales ramp is slower than planned at new locations.
- Commissions, rent, or vendor terms reduce site-level margin.
- Route mileage and service time rise as the route expands.
- Repairs, spoilage, or product mix changes increase cash leakage.
- Working capital is too thin to cover inventory and collection timing.
- Financing terms or placement terms change the payback profile.
Planning calculator: what to enter before you rely on the forecast
Illustrative placeholders only. Replace every input with your own route data, current quotes, and verified local terms before using the forecast in a lender, buyer, or investor package.
| Planning input | Why it matters | Simple formula or question | Verify with |
|---|---|---|---|
| Startup cash needed | Defines funding need and opening runway | Machine cost + install + initial inventory + setup + working capital | Vendor quotes, lease terms, lender terms |
| Monthly sales per machine | Sets the revenue base for all three years | Average sales × machine count × months in service | Pilot results, comparable routes, operator records |
| Product cost and spoilage | Drives gross margin and refill cash needs | Cost of goods sold as a share of sales | Supplier invoices, fill logs, shrink history |
| Commission or placement fee | Can reduce site contribution materially | Fixed fee or revenue share by location | Location agreement, landlord or host terms |
| Route mileage and service time | Affects fuel, labor, and scheduling capacity | Miles per week + service hours per stop | Route map, service logs, staffing plan |
| Repairs and software | Influences downtime and recurring cash use | Recurring service costs + platform fees | Maintenance plan, software contract, technician quotes |
| Labor coverage | Determines whether the route can scale smoothly | Owner-operator vs. paid support | Wage quotes, route schedule, coverage plan |
| Break-even sales | Shows the minimum sales needed to cover fixed costs | Fixed costs ÷ contribution margin per sale | Model output based on verified inputs |
| Cash runway | Shows how long the business can operate before needing more cash | Opening cash ÷ monthly cash burn | Scenario analysis using conservative assumptions |
Scenario snapshot
| Scenario | Sales pattern | Cost pressure | Cash-flow signal |
|---|---|---|---|
| Conservative | Slower ramp, weaker fill rate, more uneven traffic | Higher repairs, mileage, or commissions | Needs more startup cash and a wider safety cushion |
| Base case | Expected traffic, normal refill cadence, steady mix | Typical operating costs and service timing | Useful for lender and investor presentation |
| Upside | Better route density, stronger location mix, fewer service gaps | Lower miles per sale and more efficient labor coverage | Can support faster payback or expansion planning |
How to use the results
- Start with your most conservative sales estimate, not your target.
- Test whether the route still covers inventory, service costs, and financing.
- Check whether the cash balance survives slow months and repair spikes.
- Compare the return from adding machines versus improving existing location density.
- Use the base case for planning, then keep a downside case for funding and lease discussions.
What should you do next after mapping the three-year vending forecast?
Your forecast is only useful if it turns into a decision. For a U.S. vending machine startup, acquisition, or route expansion, the core test is simple: do the machine count, location terms, inventory turns, repairs, commissions, mileage, and working capital still make sense when you carry them across three years?
If the answer is unclear, pause before buying equipment or signing location agreements. Tighten the assumptions first, then use the model to compare a base case, a cautious case, and an upside case.
| Planning check | What “ready” looks like |
|---|---|
| Revenue assumptions | You have a realistic estimate for sales per machine, product mix, and ramp-up timing by location type. |
| Operating costs | You have inputs for inventory, route mileage, repair reserve, commissions, software, and restocking labor. |
| Cash flow timing | You know when cash goes out for equipment, inventory, and location setup versus when sales are expected to come in. |
| Funding readiness | You can explain how much capital is needed, what it covers, and how long it must last. |
| Verification | Local prices, lease terms, commissions, and vendor terms have been checked with current sources. |
Next planning steps
- Confirm your machine count, location mix, and service route assumptions.
- Update product costs, commissions, and maintenance allowances with current vendor quotes.
- Test the forecast against slower sales, higher repairs, and longer placement delays.
- Check how much working capital is needed before the route becomes self-supporting.
- Review whether the forecast supports your buy, build, or wait decision.
At this stage, a business plan, financial model, pitch deck, checklist, and startup toolkit can help organize assumptions, compare scenarios, and document the plan for partners, lenders, landlords, or advisors.
Final takeaway: if your three-year vending forecast can still survive local verification and a conservative cash-flow test, you have a workable planning base; if it cannot, refine the assumptions before you commit capital.


