
Vending Machine Cash Flow Forecast: What Drives Monthly Results
A practical U.S. planning guide for vending machine cash flow forecast: what drives monthly results, built for founders, buyers, and operators comparing assumptions before committing capital.

What drives monthly cash flow in a vending machine business?
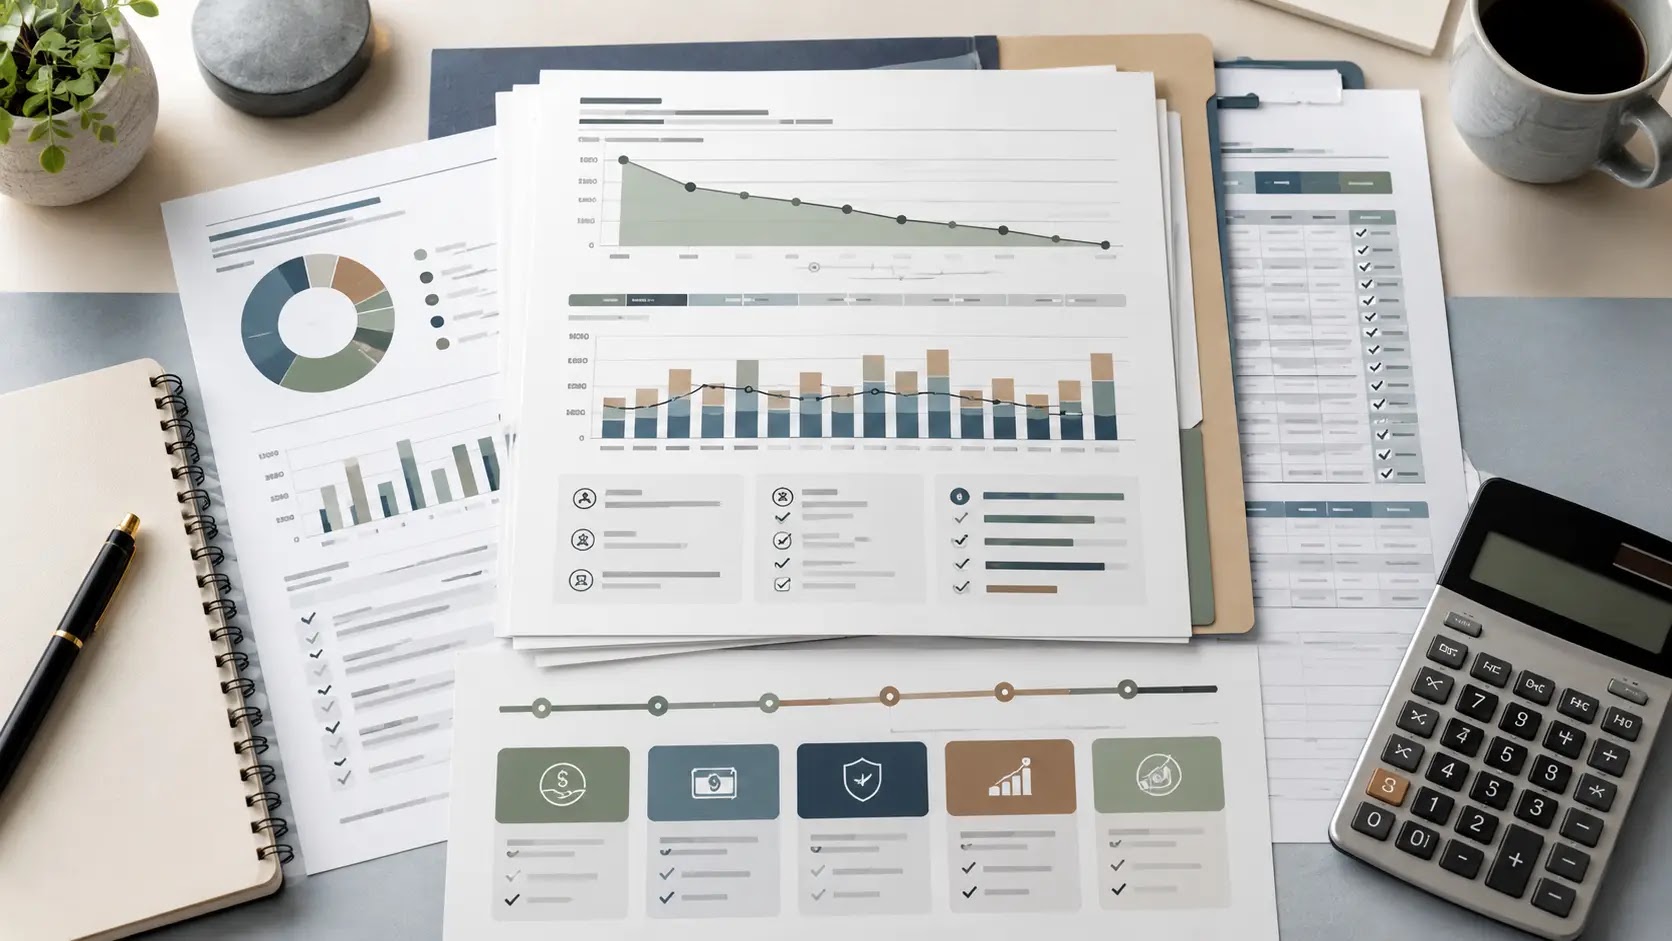
For a vending machine buyer or founder, monthly cash flow is usually driven less by a headline sales figure and more by route quality, machine uptime, site commissions, product mix, and how often the route has to be serviced. The forecast should answer one practical question: after restocking, fuel, repairs, payment fees, and other operating costs, does the route still leave enough owner earnings to justify the capital tied up in machines and inventory?
If you are buying an existing route, the key is whether reported sales can be translated into repeatable cash flow after commissions, maintenance, and replenishment timing. If you are launching, the question shifts to whether startup outflows for equipment, installation, inventory, and working capital can be covered until the route stabilizes. In both cases, the numbers need to reflect your actual locations and operating cadence, not a generic average.
That is why the forecast should start with local inputs: site terms, machine costs, restocking pattern, labor assumptions, and the cash buffer needed to keep the route moving. Those variables often matter more than the brand name of the machine or the product category.
| What the reader is deciding | What must be verified locally |
|---|---|
| Whether monthly cash flow can support the route, debt, and owner pay | Site commissions, product costs, payment fees, mileage, repair frequency, and restock timing |
| Whether startup or acquisition cash needs are realistic | Machine purchase or lease terms, installation costs, inventory minimums, and working capital needs |
- Lease, location, and any buildout or install assumptions
- Equipment purchase price, lease terms, delivery, and repair expectations
- Labor, route mileage, and servicing frequency
- Menu economics, pricing, spoilage, and shrink
- Permits, insurance, and other local operating requirements
- Working capital for inventory, maintenance, and slow-start months
- Funding readiness if the plan includes debt, seller financing, or outside capital
Next, the practical framework breaks these assumptions into the specific inputs that actually drive the monthly forecast.

Which assumptions should drive a vending machine cash flow forecast?
Start with route-level economics, not a single “average machine” number
For a U.S. vending machine business, monthly cash flow usually comes down to a few route inputs: how much each machine sells, how often it is stocked, what the product mix costs, how far the route is to drive, what the location keeps, and how much downtime or repair work shows up during the month. Those factors can move results more than the machine count alone.
A practical forecast should separate revenue drivers, operating costs, and cash timing. That makes it easier to compare a startup route, an acquisition target, or a funded expansion without blending together different site types, service schedules, or vendor terms.
| Planning area | Question to answer | Input to collect | Model impact | Verification source |
|---|---|---|---|---|
| Location performance | Which sites actually generate steady sales? | Machine-by-machine sales history, traffic pattern, product movement by site | Revenue per machine, sales volatility, site ranking | Route logs, telemetry reports, seller records, location walk-through |
| Product mix | What items sell, and at what price points? | Top-selling SKUs, package sizes, vendor price lists, retail prices | Gross margin, inventory turns, spoilage risk | Supplier quotes, POS or telemetry data, purchase invoices |
| Service frequency | How often does each machine need stocking or maintenance? | Visit schedule, refill quantity, labor minutes per stop | Route labor, fuel, and total stops per month | Service logs, route maps, operator interviews |
| Site commission or rent | What does the location keep from sales or what fixed fee applies? | Revenue share, flat fee, placement terms, renewal timing | Net sales after site payments | Signed site agreement, seller records, landlord or manager confirmation |
| Inventory cost | What does it cost to refill the machine? | Case cost, freight, taxes if applicable, spoilage or shrink allowance | Cost of goods sold and contribution margin | Supplier invoices, order history, current price quotes |
| Route mileage | How much driving is required to support the route? | Stop-to-stop distance, depot location, fuel use, vehicle wear | Delivery cost per route and per machine | Map routing, odometer logs, fuel records |
| Repairs and downtime | How often do machines break, jam, or underperform? | Repair history, spare parts usage, technician response time | Maintenance expense, lost sales from downtime | Service invoices, operator records, machine condition inspection |
| Cash handling and payment fees | How is cash collected and what fees apply to card or mobile payments? | Collection schedule, processing rates, banking deposits, shrink controls | Net receipts and cash timing | Processor statement, bank deposits, cash reconciliation logs |
| Software and admin tools | What recurring tools support route management? | Telemetry, route software, accounting tools, device subscriptions | Fixed monthly overhead | Vendor contracts, current invoices, subscription terms |
| Working capital | How much cash is needed before collections catch up? | Starting inventory, deposits, repair reserve, payroll timing, machine acquisition cash | Initial cash requirement and liquidity cushion | Opening purchase list, lender requirements, launch budget |
What is the cleanest way to move from research to documented assumptions?
- Map each machine or route segment. Group locations by traffic pattern, service frequency, and likely sales volume so one weak site does not distort the whole forecast.
- Collect evidence for sales and margins. Use actual route records where available; for a startup or acquisition, ask for machine-level sales reports, product mix, and purchase invoices.
- Confirm site terms before modeling net revenue. Document commissions, rent, utilities, exclusivity, and contract duration because these terms directly change monthly cash flow.
- Price every recurring operating cost. Include inventory, fuel, labor, maintenance, payment processing, software, and any outside service support tied to route execution.
- Separate startup cash from monthly profit. Capture machine purchase or lease costs, refurbishment, initial fill inventory, deposits, spare parts, and any launch-day administrative expenses.
- Write down the assumption source and date. Keep a simple assumption log with who provided the number, when it was checked, and whether it came from a contract, quote, or historical record.
- Stress-test the route before committing. Flag the assumptions most likely to move cash flow: lower sales at marginal sites, higher service mileage, slower collections, or unexpected repairs.
Verification note: vending commissions, site terms, insurance requirements, payment processing fees, repair costs, and local operating rules vary by market and vendor. Verify current terms with the location owner, equipment supplier, processor, insurer, and local sources before you lock the forecast.
Once these inputs are documented, the next step is to translate them into monthly scenarios, contribution margin, and break-even ranges in the financial model.
Which assumptions move monthly cash flow the most?
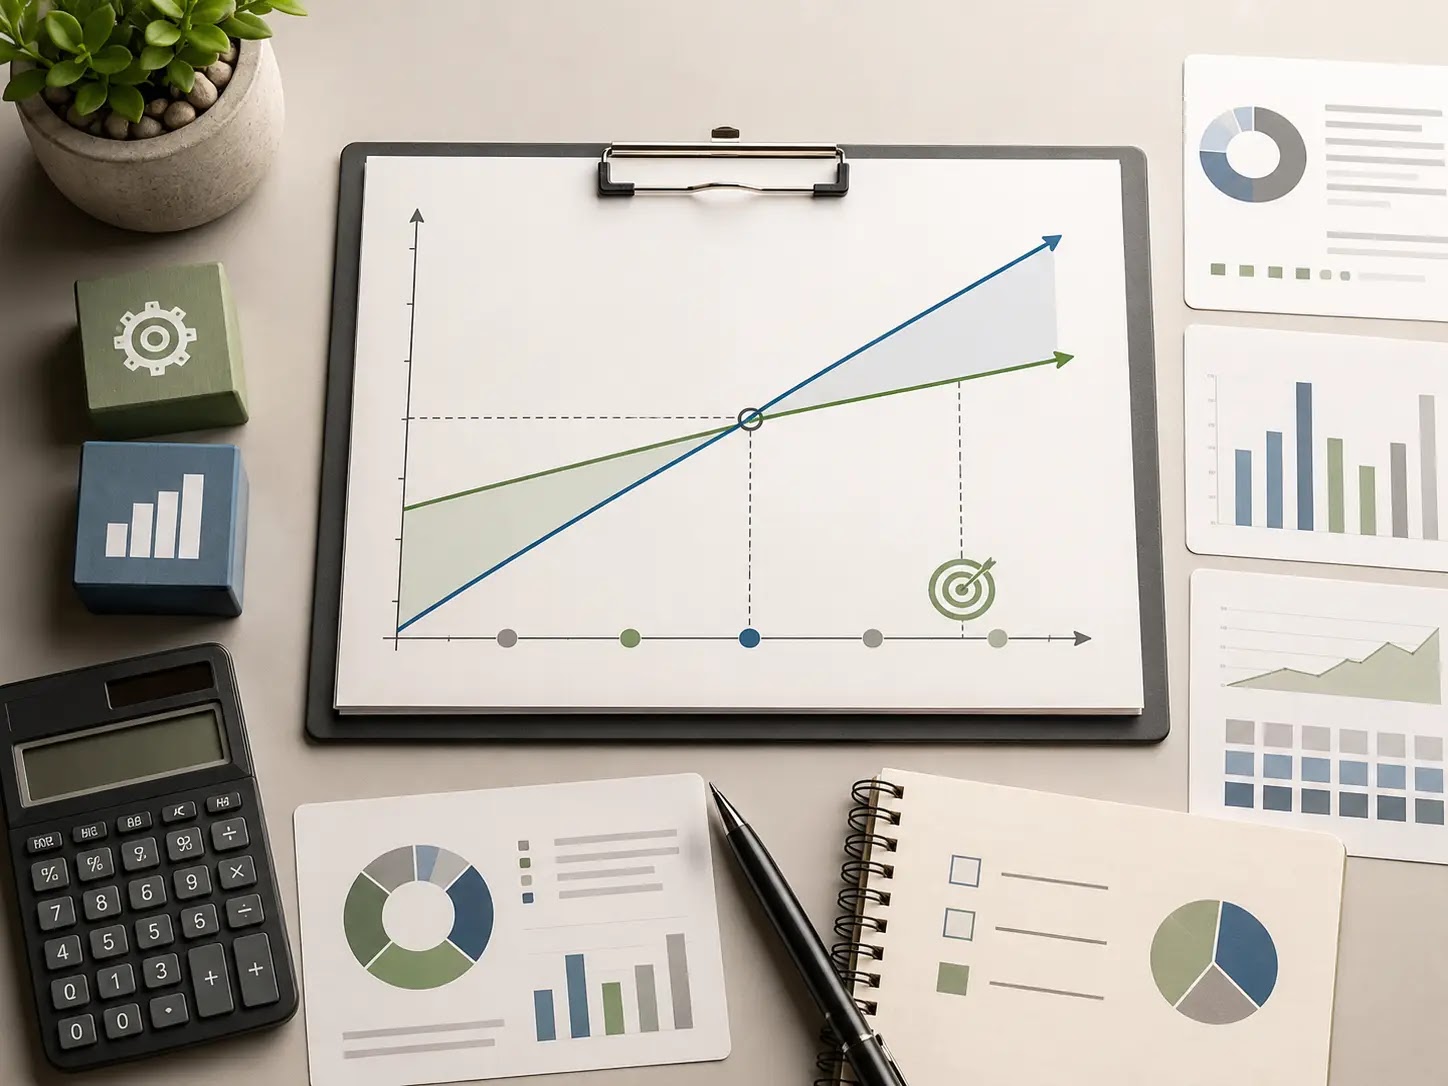
For a vending machine route, monthly cash flow usually turns on a few variables more than on headline sales alone: machine uptime, placement commissions, route density, product mix, repairs, and labor coverage. A route can look fine on gross revenue and still produce weak owner earnings if commissions, mileage, spoilage, and debt service consume the margin.
The planning risk is usually not one big mistake. It is a stack of small assumptions that all lean optimistic at the same time: too much sales per machine, too little service time, no reserve for repairs, and a route that is farther apart than expected. That is why the forecast should separate gross sales, cash operating costs, and debt or lease payments.
Monthly cash-flow calculator
| Line item | Simple formula | Why it matters |
|---|---|---|
| Machines in service | Enter your count | Drives sales potential and service workload. |
| Average monthly sales per machine | Enter your estimate | Main driver of gross revenue. |
| Average selling price / vend | Enter your mix-based price | Product mix can change revenue and margin. |
| Estimated gross sales | Machines × sales per machine | Top-line starting point for the forecast. |
| Product cost | Gross sales × COGS % | Determines gross margin before route costs. |
| Placement commissions / site fees | Enter monthly amount | Can materially reduce net cash per location. |
| Repairs, spoilage, and service reserve | Enter monthly reserve per machine × count | Protects the model from uptime and maintenance surprises. |
| Route mileage, fuel, and vehicle reserve | Enter monthly transport cost | More dispersed routes usually cost more to service. |
| Labor coverage | Owner time or hired help cost | Important if the route is too large for one person. |
| Software, payment processing, and overhead | Enter monthly fixed cost | Small recurring items add up across the route. |
| Debt service, if any | Loan or lease payment | Critical for funding readiness and break-even. |
| Estimated monthly cash flow | Gross margin − cash operating costs − debt service | Core result to compare against working capital. |
| Runway | Cash on hand ÷ monthly burn | Shows how long the business can absorb a weak month. |
What to test first in the forecast
- Sales per machine by location type, not one blended average for every site.
- Commission or placement terms, including any minimums or revenue-share structure.
- Route density, because miles and travel time can change owner earnings quickly.
- Labor coverage, especially if servicing, restocking, and cash collection exceed solo capacity.
- Repair and spoilage reserve, so the model does not assume perfect uptime.
- Debt service or equipment payments, since they can turn a thinly profitable route into a cash strain.
Risk check: If your forecast only works when every site performs at the top of the range, the model is probably too tight. A practical plan should survive slower sales, higher commissions, and a few extra service calls without immediately starving working capital.
How do the scenario assumptions change the result?
| Scenario | Sales assumption | Cost pressure | Cash-flow takeaway | What to verify |
|---|---|---|---|---|
| Base case | Expected sales per machine, based on current route data | Normal commissions, mileage, and service frequency | Shows whether the route is likely to support owner pay and debt service. | Compare against actual location data and vendor quotes. |
| Downside case | Lower sales at weaker sites or slower new placements | Higher relative impact from fixed costs | Tests whether cash reserves are enough to absorb a soft launch or a weak season. | Stress-test working capital and break-even sales. |
| Cost-stress case | Base sales, but higher commissions, fuel, or repair needs | More route friction and service expense | Shows how much margin is left after the route is actually operated, not just planned. | Use current local quotes and replacement-cost assumptions. |
Verification note: Vending cash flow varies by market and by site. Replace every placeholder with current supplier quotes, location commissions, equipment pricing, route mileage, repair rates, payment-processing terms, financing terms, and any local requirements that apply to your market. Verify the numbers with current local sources before using the forecast for buying, funding, or launch decisions.

What should you do next before treating the forecast as decision-ready?
Practical recap: monthly cash flow in vending is usually driven by machine utilization, product mix, route density, commissions, service frequency, repair exposure, and working capital. A forecast is only useful when it is tied to specific locations, real vendor terms, and realistic restock and mileage assumptions.
If the route has steady traffic, sensible placement economics, and enough margin after inventory, commissions, software, fuel, and maintenance, the model can support a startup, acquisition, or expansion decision. If not, the same forecast should be used to pressure-test whether to renegotiate locations, change the mix, or pass on the deal.
Decision checklist: are you ready to rely on the monthly forecast?
| Readiness area | What “ready” looks like | What still needs verification |
|---|---|---|
| Locations | Each machine is tied to a specific site with known traffic and placement terms. | Site performance, commission terms, and any exclusivity or renewal language. |
| Revenue assumptions | Sales per machine are based on route history, location type, or comparable operations. | Seasonality, downtime, underperforming machines, and product mix sensitivity. |
| Operating costs | Inventory, mileage, labor, repairs, software, and fees are all captured in the model. | Vendor pricing, service intervals, and any owner time not yet priced in. |
| Cash cushion | Working capital is enough to cover slow starts, refills, maintenance, and delays. | How much cash is needed before monthly collections stabilize. |
| Decision use | The forecast can support a buy, build, finance, or hold decision. | Whether the deal still works under weaker sales or higher costs. |
Next planning steps
- Confirm route-level sales assumptions for each machine or site group.
- Verify product cost, commission, restocking frequency, and mileage inputs.
- Test the forecast under a slower sales case and a higher-cost case.
- Separate one-time startup or acquisition costs from monthly operating cash flow.
- Review repair, software, and cash handling assumptions before finalizing break-even.
- Document the assumptions you can verify with current local vendors, landlords, and operators.
Helpful planning bridge: if you are turning this into a real go/no-go decision, a business plan, financial model, pitch deck, checklist, and startup toolkit can help organize assumptions, compare scenarios, and document the plan for partners, lenders, landlords, or advisors.
Final takeaway: for a U.S. vending machine founder or buyer, the best forecast is the one built from verified route inputs, not averages. Tighten the assumptions first, then use the monthly cash flow view to decide whether the opportunity is worth funding, buying, or launching.


