
Vending Machine Best-Case, Base-Case, and Worst-Case Forecast Scenarios
A practical U.S. planning guide for vending machine best-case, base-case, and worst-case forecast scenarios, built for founders, buyers, and operators comparing assumptions before committing capital.

What do best-case, base-case, and worst-case vending machine forecasts tell you?
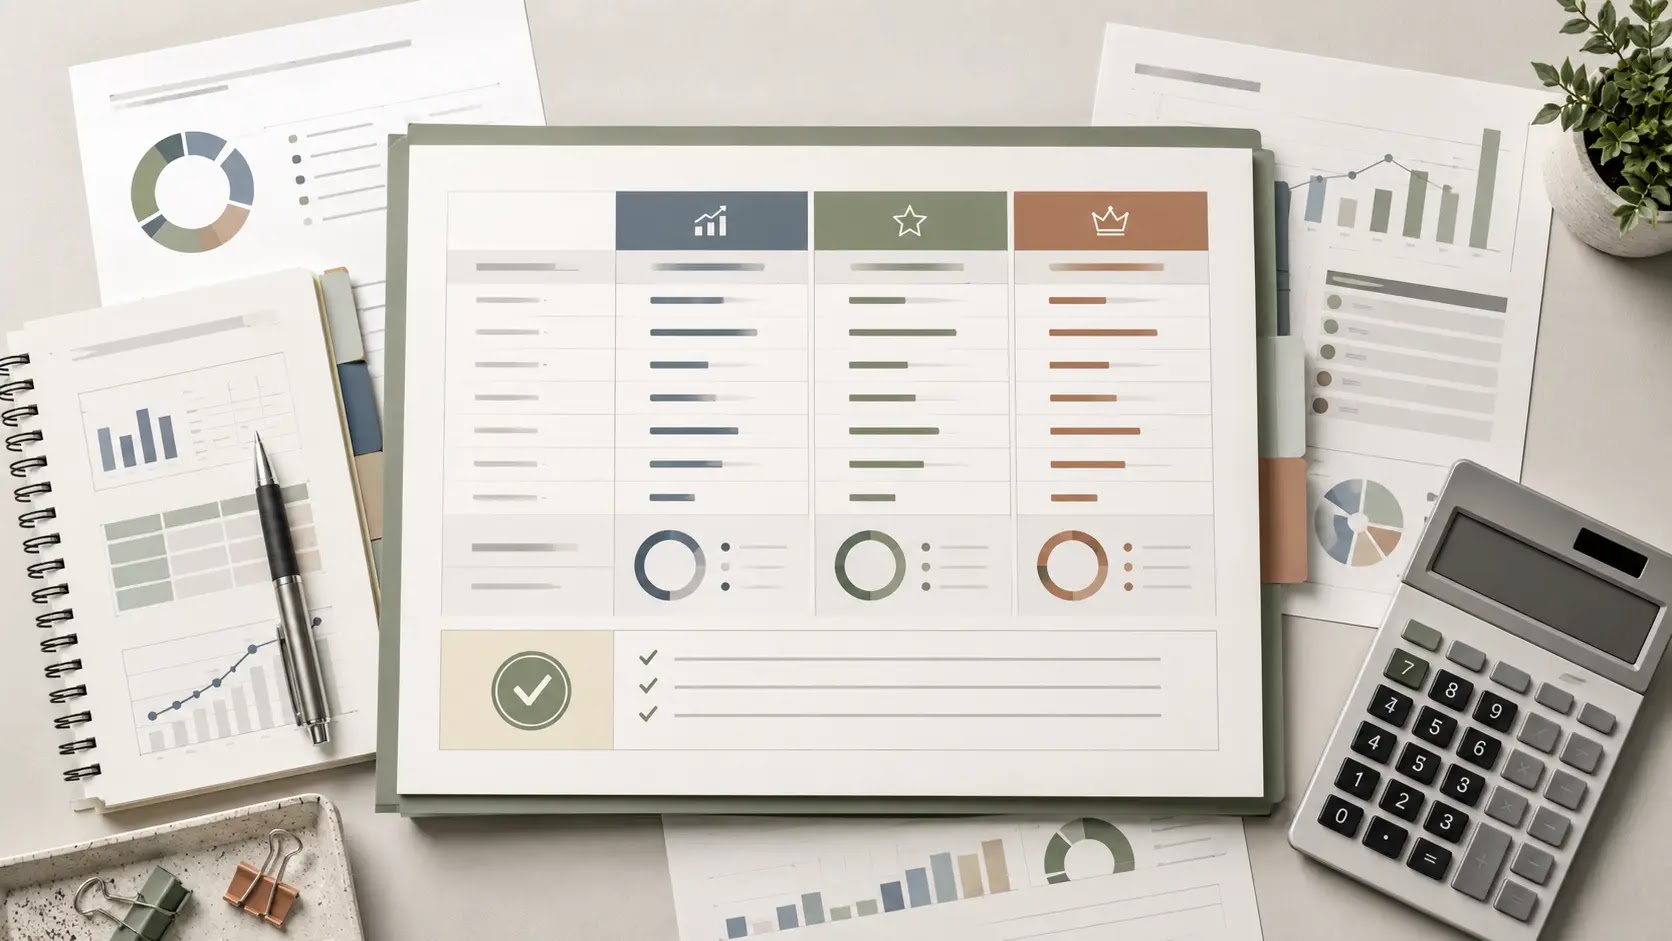
If you are buying, starting, or expanding a vending machine route, scenario forecasts help you decide whether the business still works when sales, downtime, and location terms move against you. The goal is not to guess one “right” number; it is to test whether the route can support machines, inventory, mileage, repairs, software, commissions, and working capital under different operating conditions.
A practical forecast should compare a stronger-than-planned route, a normal operating month, and a weaker month so you can judge margin, owner earnings, and break-even sensitivity. For a U.S. vending business, the most important inputs usually come from the specific locations, the machine mix, the product menu, and the vendor and landlord terms attached to each stop.
Quick decision frame
| What the reader is deciding | What must be verified locally |
|---|---|
| Whether the route can produce acceptable profit in best-case, base-case, and worst-case conditions | Location traffic, sales history if available, commissions or revenue shares, machine reliability, route density, and local operating costs |
Big assumption categories to validate
- Lease or location terms, including commissions, access, and renewal risk
- Equipment condition, age, repair exposure, and replacement timing
- Labor and route servicing time, especially if you will hire help
- Menu economics, including product mix, pricing, spoilage, and shrinkage
- Permits, insurance, and any location-specific operating requirements
- Working capital for inventory, cash float, repairs, and replenishment timing
- Funding readiness, including what lenders or investors will want to see in the model and pitch deck
Used well, these assumptions make the forecast more useful than a single revenue estimate because they show where the business is resilient and where it is fragile. That matters whether you are underwriting an acquisition, preparing startup funding materials, or deciding how many machines to place before launch.
Next, we’ll turn these inputs into a practical scenario framework you can use to compare cases and pressure-test the economics.
How should a vending machine founder build best-case, base-case, and worst-case assumptions?
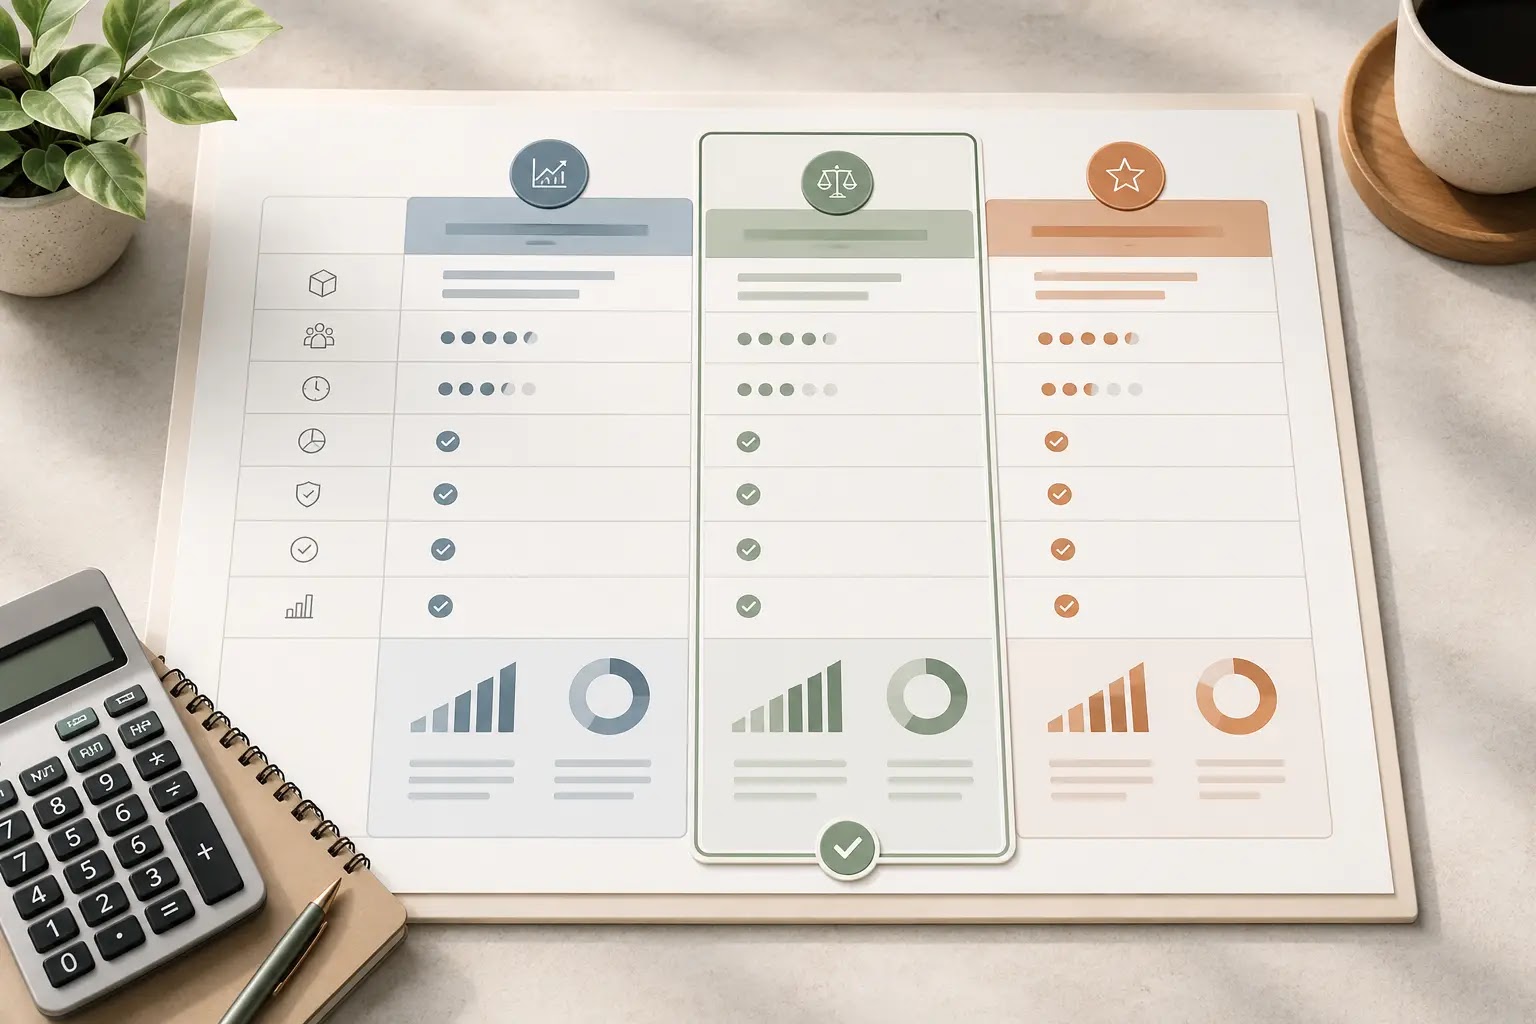
For a U.S. vending machine business, the scenario framework should be built around route and unit economics: machine count, vend frequency, average sales per stop, inventory turns, commissions, mileage, repairs, software, and the working capital needed to keep the route stocked and serviced. The goal is not to guess one “right” forecast, but to document the inputs that make the upside, midpoint, and downside cases materially different.
Which assumptions matter most in route and unit economics?
| Planning area | Question to answer | Input to collect | Model impact | Verification source | Assumption affected |
|---|---|---|---|---|---|
| Machine count and placement mix | How many machines are active, and how are locations distributed? | Placed machines, secured leads, replacement timing, and location type mix | Drives total sales, route density, and service time | Signed location agreements, route map, prospect pipeline | Revenue, mileage, and labor efficiency |
| Sales per machine | What does each machine realistically sell in a strong, normal, and weak month? | Recent sales logs, foot traffic notes, seasonality pattern, product mix | Sets the revenue range for each scenario | Machine telemetry, cash counts, POS reports, operator records | Gross revenue and inventory demand |
| Vend frequency | How often does each machine need service to avoid stockouts? | Refill cadence by location and product category | Affects labor, fuel, and route scheduling | Route logs, driver notes, location history | Route efficiency and labor hours |
| Product cost and mix | What does inventory cost, and how does mix change margins? | Supplier quotes, product case costs, package sizes, spoilage risk | Determines gross margin and cash tied up in inventory | Vendor invoices, distributor quotes, purchase orders | COGS, cash conversion cycle, shrink |
| Location commissions and fees | What does each site require in commissions, rent, or revenue share? | Location terms, minimum guarantees, payment schedule | Reduces contribution margin per machine | Draft contracts, signed agreements, landlord or site contact terms | Net revenue and break-even threshold |
| Fuel, mileage, and route density | How much travel is required to service the route? | Miles per stop, route clustering, vehicle assumptions, fuel cost inputs | Influences delivery cost and owner time | Route map, GPS logs, fuel receipts, service schedule | Operating expense and owner earnings |
| Repairs and downtime | What maintenance burden should each scenario assume? | Repair frequency, parts cost, service vendor terms, downtime days | Impacts availability, lost sales, and cash reserve needs | Repair history, technician quotes, warranty terms | Net profit and working capital |
| Software, payment systems, and cash handling | What tools are needed to track sales and collect payments? | Telemetry, cashless payment fees, routing software, bank deposit workflow | Raises recurring overhead but can improve visibility and collection speed | Vendor proposals, processor terms, software demos | Monthly overhead and reporting quality |
| Working capital reserve | How much cash is needed to stock, service, and absorb slow starts? | Inventory float, service float, rent/commission timing, reserve target | Prevents an overly optimistic forecast from masking liquidity risk | Bank plan, supplier terms, launch budget | Funding need and runway |
How should the founder turn research into documented assumptions?
- Separate the route into machine-level units so each stop has its own sales, commission, and service pattern.
- Collect recent or comparable sales evidence for each location type and mark which data points are confirmed versus estimated.
- Record product cost, fill cadence, and spoilage assumptions by category rather than using one blended average.
- Estimate miles, service time, and vehicle cost per route cluster so travel does not disappear inside overhead.
- Model commissions, card fees, repairs, and software as recurring operating items tied to the route, not as one-time startup noise.
- Set a working capital reserve for inventory and operating delays before treating any scenario as financeable.
- Label best-case, base-case, and worst-case inputs with the source behind each number, especially for landlord terms, vendor pricing, and route efficiency.
- Review whether the downside case still covers the fixed monthly burden before assuming the route can scale safely.
What should be verified before the numbers go into the model?
- Location terms and any commission structure tied to each site
- Supplier quotes for the products actually expected to sell
- Cashless payment processing and telemetry vendor terms
- Repair, maintenance, and restocking assumptions based on real route conditions
- Route mileage, clustering, and vehicle use assumptions
- Inventory float and reserve cash needs for a slow launch period
Verification note: Keep the source for each assumption attached to the scenario sheet or model notes. In vending, small changes in sales per stop, refill cadence, and commission terms can move the economics more than a broad market estimate.
This framework gives the founder a defensible input map for the forecast. Block 3 can then test those assumptions against revenue, margin, owner earnings, and break-even outcomes across the three scenarios.
What can push a Vending Machine forecast up or down?
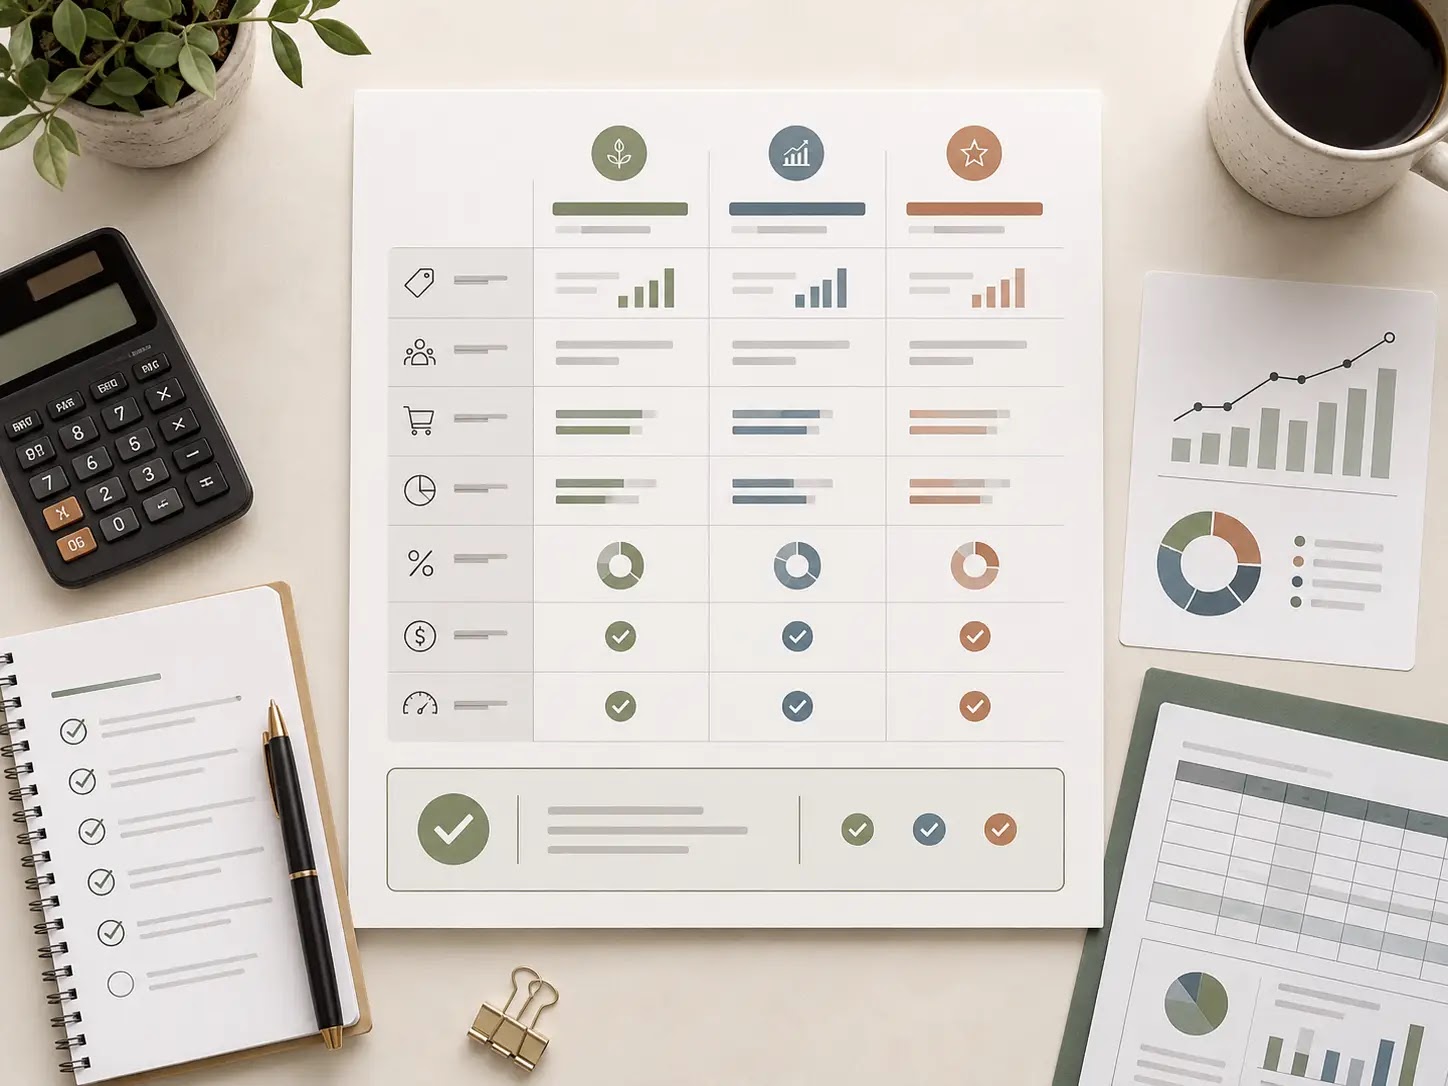
For a vending machine business, the biggest forecast swing usually comes from location quality, refill discipline, and downtime. A machine that looks strong on paper can underperform if foot traffic is inconsistent, products turn slowly, or service visits are too far apart. In the best case, dense routes, stable site access, and fast-moving inventory improve gross margin and owner earnings; in the worst case, weak placement, frequent repairs, and poor product mix compress cash flow quickly.
That is why the base-case should be built from documented assumptions, not optimism. Treat revenue per machine, product cost, commissions or placement fees, service frequency, spoilage or shrink, fuel and route mileage, and maintenance as separate inputs. Small changes in any one of them can move the break-even point materially, especially when a route is still small and fixed costs are spread across only a few machines.
Best-case scenario
High-traffic placements, reliable machine uptime, strong product rotation, and efficient route clustering. This scenario is most useful for testing upside, but it should still assume real refill time, normal spoilage, and occasional service calls.
Planning effect: Higher sales per stop, better labor efficiency, and stronger cash generation after inventory and route costs.
Base-case scenario
Moderate traffic, steady refill cadence, average maintenance needs, and normal vendor pricing. This should be the operating case used for lender discussions, buyer comparisons, and day-one staffing or inventory planning.
Planning effect: Reveals whether the route can support working capital, repairs, and owner draw without depending on unusually strong performance.
Worst-case scenario
Lower-than-expected sales, missed refills, repair delays, weaker commissions, and less efficient routing. This is the stress case for checking whether the business can absorb slow starts, machine downtime, or a bad location mix.
Planning effect: Shows how quickly cash can tighten and whether the business needs more reserve capital than the base-case suggests.
Use the spread between these scenarios to test assumptions, not to chase the best number. If the worst-case still leaves enough room for inventory buys, fuel, service labor, and debt service or lease payments, the plan is more resilient. If it does not, the model may need better locations, fewer machines, more working capital, or a slower rollout.
| Planning risk | Why it matters in a vending machine business | Assumption affected | How to verify |
|---|---|---|---|
| Location traffic overestimation | Sales can fall short if the site has less repeat foot traffic than expected. | Revenue per machine, payback period, break-even timing | Review site history, observe traffic patterns, and confirm with the location contact. |
| Placement fees or commission changes | Revenue share or rent can reduce gross margin more than expected. | Net margin, owner earnings, location contribution | Check the current vendor agreement and confirm renewal terms in writing. |
| Route inefficiency | Long drives and scattered stops raise labor and fuel costs. | Route mileage, service time, operating expense | Map the route, log drive times, and compare clustered versus spread-out stops. |
| Machine downtime or repairs | Broken machines stop sales and may create emergency service costs. | Availability, maintenance reserve, cash flow | Inspect machine age, service history, warranty status, and parts access. |
| Product mix mismatch | Slow-moving items tie up cash and reduce repeat purchases. | Inventory turns, spoilage or shrink, gross margin | Track sales by SKU and test a small mix before scaling. |
| Working capital shortfall | Inventory, repairs, and refill timing can create cash pressure early on. | Startup funding need, reserve balance, launch runway | Build a cash buffer model that includes refills, maintenance, and delayed ramp-up. |
The practical question is not whether the best-case looks attractive; it is whether the business still works when the assumptions soften. If the numbers only work under unusually strong traffic or unusually low repair costs, the model needs more cushion. The final action checklist should turn these risks into a short list of verification steps so the forecast is grounded before you commit capital or expand the route.
What should you do next before committing to a vending scenario?
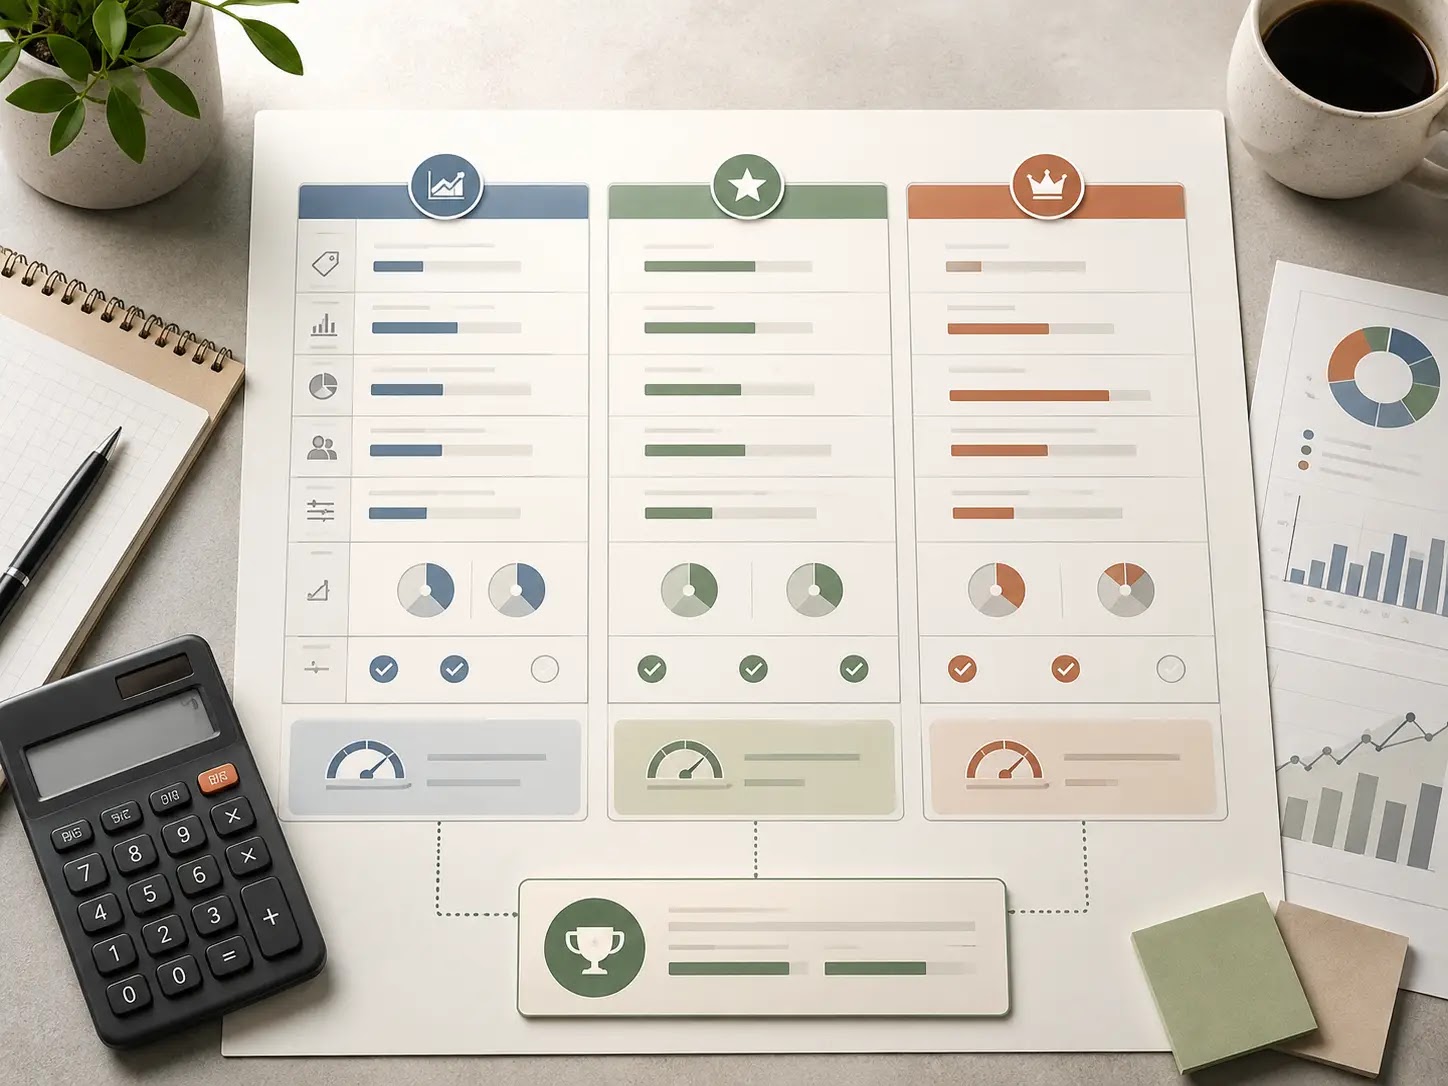
The practical decision is not which scenario sounds best — it is whether your best-case, base-case, and worst-case forecasts are built on the same route logic: machine count, location performance, inventory turns, commissions, service time, mileage, repair reserves, and working capital. If those inputs are documented, the scenarios become useful for startup, acquisition, funding readiness, and launch planning. If they are not, the forecast is still a guess.
For a U.S. vending machine founder or buyer, the next step is to tighten the assumptions, test the downside, and make sure the plan can survive slower sales, higher restock costs, or more service calls than expected.
| Readiness check | What to confirm | Why it matters |
|---|---|---|
| Route assumptions | How many machines, which locations, and how often each will be serviced | Drives revenue, labor, and mileage |
| Margin inputs | Inventory cost, commissions, spoilage, and repair allowance | Shows whether sales volume turns into owner earnings |
| Downside exposure | What happens if sales are slower or a location underperforms | Tests break-even and cash cushion needs |
| Funding readiness | Whether the model supports lender, landlord, or partner review | Improves decision quality and documentation |
| Operating buffer | Working capital for inventory, repairs, refills, and rollout timing | Reduces launch stress during the first months |
Next-step checklist
- Lock the assumptions that change the forecast: route size, location mix, commissions, mileage, and service frequency.
- Build best-case, base-case, and worst-case versions from the same input set so the comparison stays consistent.
- Test break-even using the worst-case version first, then check whether cash reserves cover the gap.
- Verify machine pricing, vendor terms, lease terms, and local operating costs with current sources before relying on the model.
- Document the plan in a format you can share with partners, lenders, landlords, or advisors.
Final takeaway: use the best-case, base-case, and worst-case forecast to decide whether the vending route still works when sales are slower, costs are higher, and service needs are less efficient than expected. If the downside still holds, the plan is worth a closer look.


