
Vending Machine KPI Dashboard: Metrics Owners Should Track
A practical U.S. planning guide for vending machine kpi dashboard: metrics owners should track, built for founders, buyers, and operators comparing assumptions before committing capital.

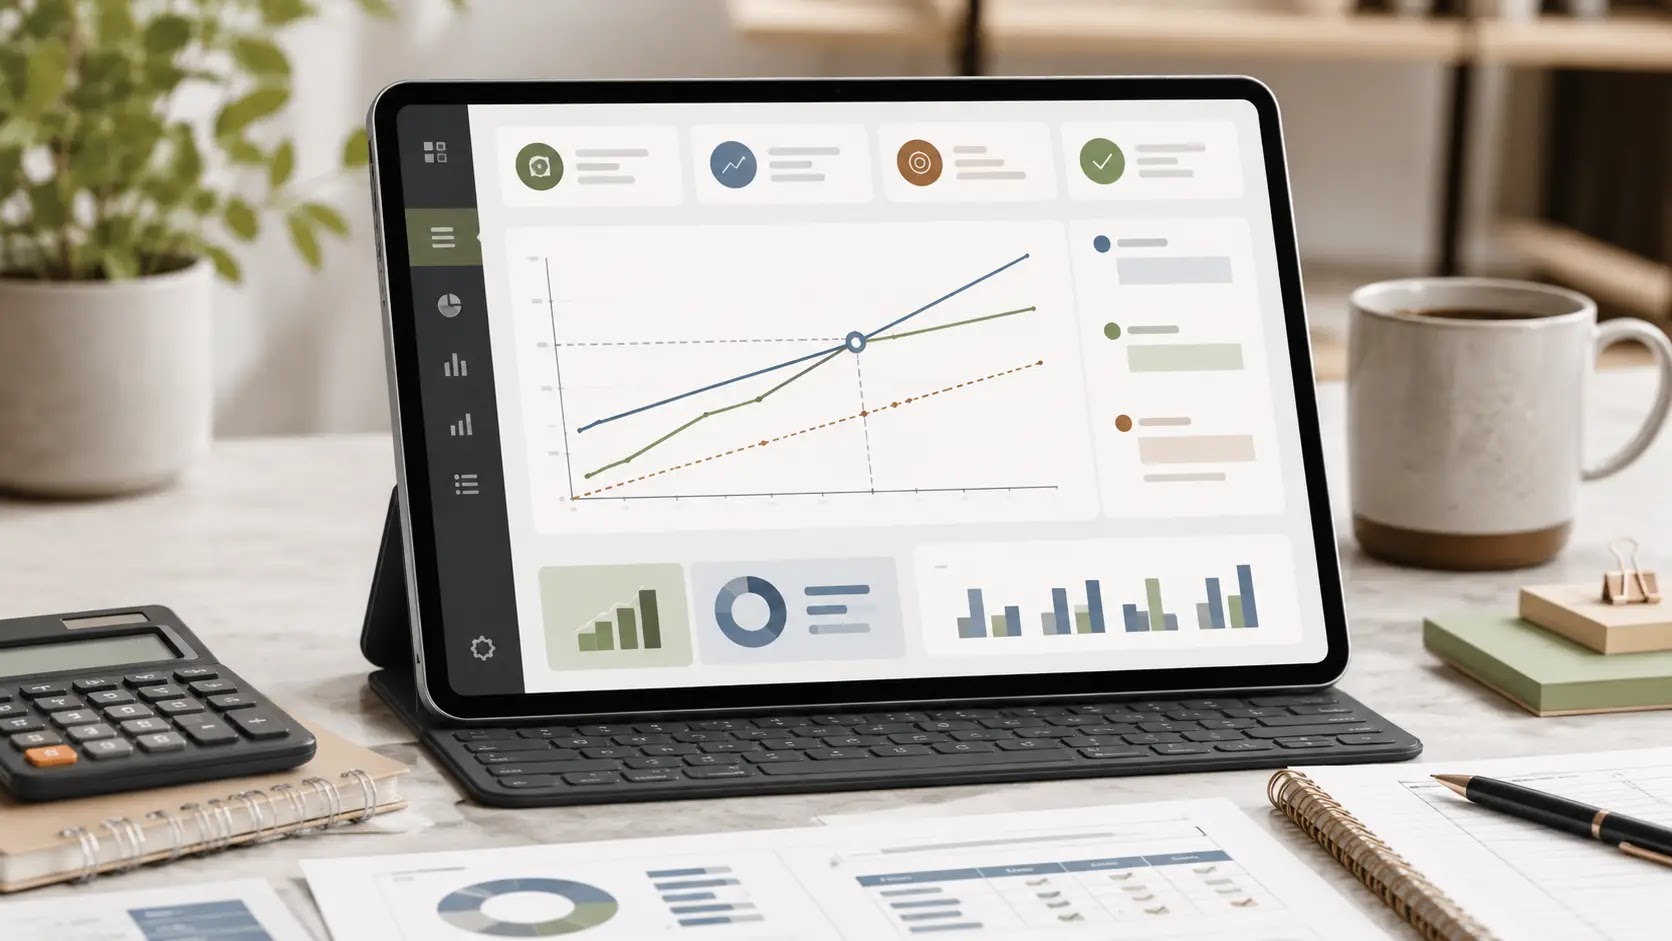
What KPIs should a vending machine owner track to judge profitability and break-even?
For a U.S. vending machine founder, buyer, or operator, the dashboard should answer one practical question: does this machine or route produce enough margin after product cost, commissions, repairs, travel, and restocking time to support owner earnings?
The most useful KPI set connects machine-level sales and uptime to route-level labor, mileage, inventory, and cash needs. That makes it easier to compare a startup site, an acquisition, or a new location, and to explain the assumptions clearly in a lender or pitch-deck context.
Because vending economics vary by market and site type, the dashboard only works if the local inputs are verified before you rely on the numbers.
Quick decision frame
| What the reader is deciding | What must be verified locally |
|---|---|
| Whether a machine, site, or route can support profitable, repeatable operation. | Location traffic, commission or rent terms, machine price, inventory costs, route mileage, service labor, repair frequency, and financing conditions. |
- Lease or placement terms, including commission structure and access rules
- Equipment cost, install needs, and expected maintenance burden
- Menu economics, including product mix, pricing, shrink, and spoilage risk
- Labor time, route mileage, and replenishment frequency
- Permits, vendor terms, and any location-specific operating requirements
- Working capital for inventory, repairs, deposits, and launch timing
- Funding readiness if the plan depends on debt, a partner, or acquisition financing
With those local assumptions identified, the next step is to turn them into a practical KPI framework that shows which inputs matter most and how they affect revenue, margin, and cash flow.
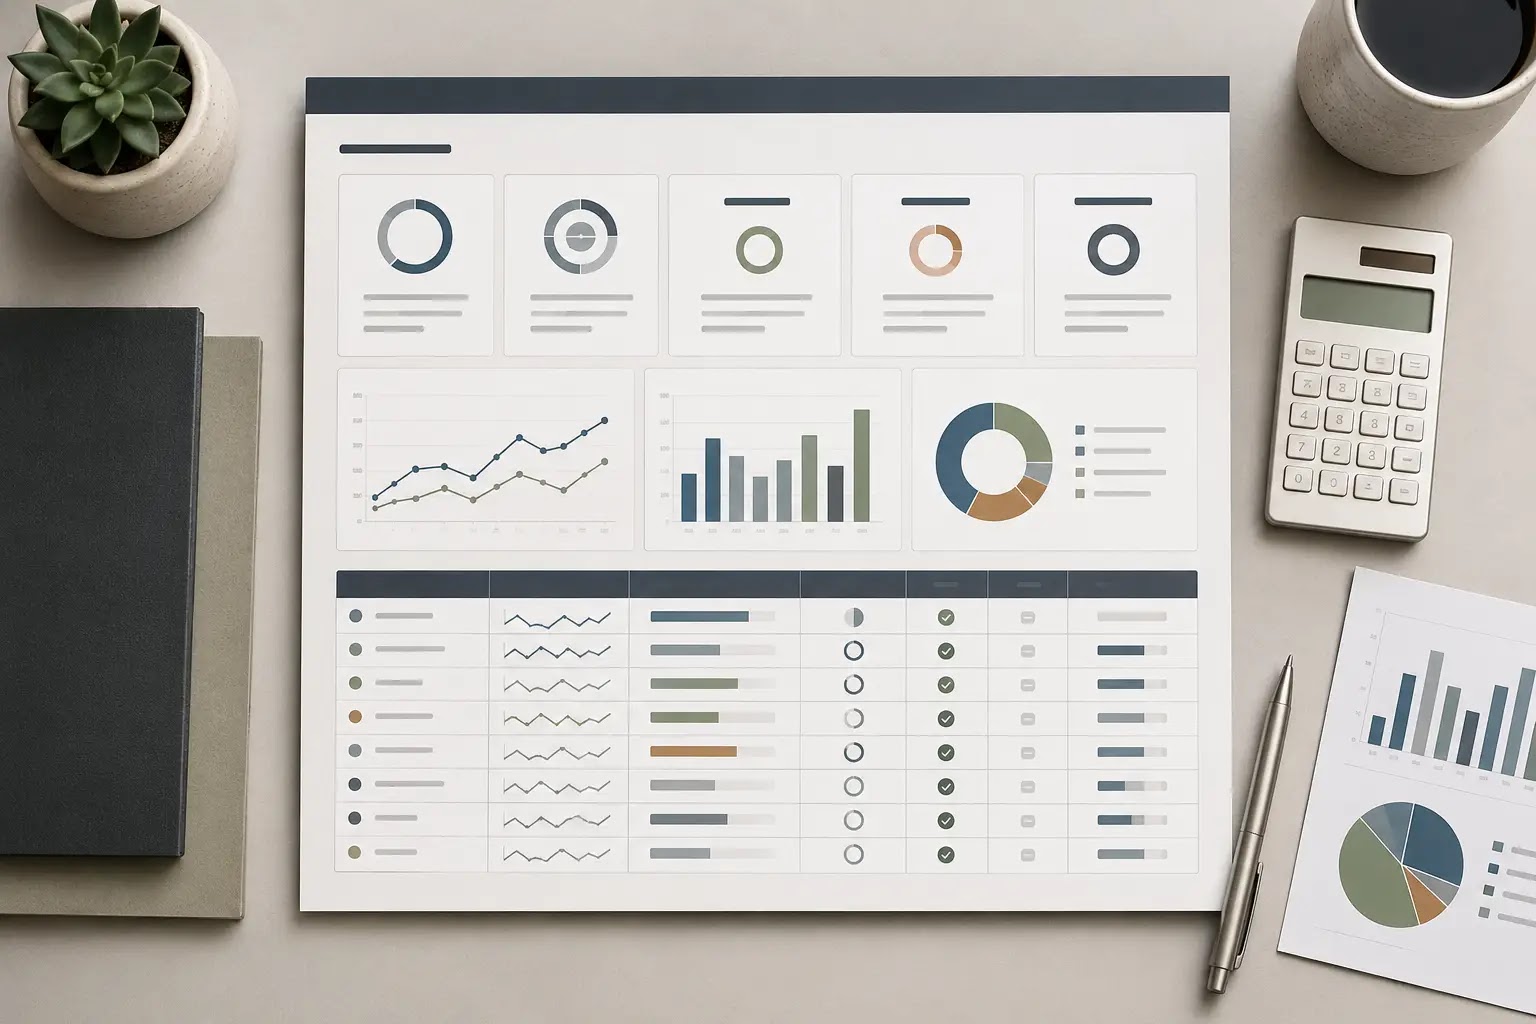
Which vending KPIs should owners track before they model route economics?
For a vending machine business, the dashboard should not just show sales. It should show whether each machine, location, and route can support freight, inventory, commissions, service time, repairs, and owner pay after normal operating friction. That means tracking machine-level revenue, product mix, refill cadence, mileage, downtime, and cash handling or cashless fees as documented assumptions—not guesses.
What inputs drive the route-unit economics model?
| Planning area | Question to answer | Input to collect | Model impact | Verification source |
|---|---|---|---|---|
| Machine revenue | How much does each machine generate by location type? | Weekly or monthly sales by machine | Revenue per unit, route total revenue, break-even pace | Sales reports, cash counts, telemetry, POS history |
| Product mix | Which items actually sell, and at what margin? | Unit sales by SKU, wholesale cost, sell price | Gross margin, category mix, replenishment planning | Supplier invoices, machine sales logs, planograms |
| Location economics | What does each site require in commissions or rent? | Location fee, revenue share, or placement terms | Net revenue after site payments | Signed location agreement, operator notes, landlord terms |
| Service cadence | How often must the machine be stocked or serviced? | Refill frequency, service time per stop, route schedule | Labor hours, route density, fuel and dispatch efficiency | Route logs, driver records, technician time stamps |
| Inventory flow | How much inventory is tied up between purchase and sale? | Par levels, reorder timing, spoilage or shrink assumptions | Working capital need, inventory turns, cash conversion timing | Supplier lead times, counts, spoilage records, stock sheets |
| Cash handling | What is collected in cash and what is processed electronically? | Cash share, card share, merchant service fees, settlement timing | Net receipts, cash reconciliation, fee drag | Reader statements, bank deposits, cash logs, processor terms |
| Downtime and repairs | How often is a machine unavailable or out of service? | Repair count, parts cost, technician visits, downtime days | Lost sales, maintenance reserve, replacement planning | Repair tickets, vendor invoices, maintenance logs |
| Route mileage | How much travel is required to support the network? | Miles per route, stops per trip, fuel and vehicle use | Delivery cost, labor efficiency, route clustering value | GPS logs, fuel receipts, dispatch records, map routing |
| Owner labor | How much management time does the route consume? | Hours for stocking, ordering, reconciliations, vendor follow-up | Owner earnings, staffing need, scalability assumptions | Time logs, work schedule, operator estimates |
| Growth and replacement | Can the route absorb new machines or replacement units? | Available cash, expected deployment pace, spare equipment need | Capex timing, funding need, expansion feasibility | Purchase quotes, lender terms, internal deployment plan |
How should a founder turn research into documented assumptions?
- Separate machines by location type. Group sites by traffic pattern, access, and stocking burden so the dashboard does not hide weak locations inside route averages.
- Pull site-level sales history. Use machine reports, cash counts, or telemetry to estimate sales by unit instead of relying on a single route-wide number.
- Map product mix to gross margin. Record the SKU, purchase cost, retail price, and likely sell-through so margin assumptions match actual inventory behavior.
- Document each location’s payment terms. Note commissions, rent, minimum guarantees, or shared-revenue terms where they exist, because site payments can change net economics materially.
- Measure servicing effort. Track refill frequency, stop duration, route miles, and downtime so labor and fuel assumptions reflect the real operating load.
- Capture repair and replacement history. Log vending machine maintenance, parts, and out-of-service days so the model includes a realistic reserve for recurring issues.
- Check inventory working capital. Estimate how much cash is tied up in stock between purchase, refill, and sale, especially when stocking multiple machines across a route.
- Set conservative, base, and upside cases. Keep the assumptions tied to documented evidence so later financial modeling can test what happens if sales, margin, or route efficiency move up or down.
What should the KPI dashboard make visible every week?
Revenue per machine
Shows which units justify their location, labor, and replenishment cost.
Gross margin by SKU
Helps identify products that sell well but do not contribute enough after cost of goods.
Stops per route and miles per stop
Measures route density and the amount of travel required to support sales.
Downtime and service exceptions
Highlights machines that lose sales because of maintenance, access issues, or slow response.
Inventory turns and refill frequency
Shows whether stock is moving fast enough to avoid excess capital tied up on the shelf.
Owner labor per route
Connects day-to-day operation with the owner’s actual earnings and scalability.
Once these inputs are documented, the next block can translate them into margin, break-even, and scenario tradeoffs for the financial model and risk check.

What assumptions can change a vending machine KPI dashboard the most?
A vending machine KPI dashboard is useful only if the underlying assumptions are realistic. The biggest swing factors are usually route density, machine utilization, product mix, spoilage and shrink, repair frequency, service time, commissions or location fees, software costs, and how much driving the route requires. If those inputs are too optimistic, the dashboard can make a marginal route look healthy.
For owners and buyers, the main planning question is not just “what did the machines do last month?” It is “which of those results will continue after the lease, placement, vendor, or route changes?” That matters because a machine in a strong location with low service time can support a different earnings profile than the same machine with longer mileage, more stockouts, or higher maintenance calls. Keep the assumptions separate by location, machine type, and contract terms.
When you compare cases, focus on whether the dashboard still works if sales soften, service trips rise, or repair costs are less predictable than expected. That is especially important for funding readiness and acquisition review, where lenders, partners, or buyers will look for evidence that owner earnings are supported by repeatable route economics rather than one-off performance.
Planning scenarios to stress-test
- Base case: current sales, normal refill cadence, and typical service costs.
- Downside case: lower machine usage, more stockouts, or weaker location retention.
- Operational strain case: higher route mileage, more repairs, or slower restocking.
What each scenario should reveal
- Whether gross margin holds after commissions, spoilage, and replenishment costs.
- Whether labor and driving time leave enough room for owner earnings.
- Whether working capital can absorb repair delays or inventory resets.
| Planning risk | Why it matters | Assumption affected | How to verify |
|---|---|---|---|
| Location demand is weaker than expected | Sales per machine can fall even when the machine is stocked and operational | Revenue per stop, utilization, and break-even timing | Review current sales history, foot traffic evidence, and placement records by site |
| Commission or placement terms change | Net margin can shrink after revenue-sharing or fixed location fees | Gross margin and owner earnings | Confirm current contract terms with the location owner or landlord |
| Repairs and downtime are more frequent | Out-of-service machines reduce sales and add labor and parts costs | Maintenance budget, uptime, and service labor | Check maintenance logs, supplier support terms, and replacement-part availability |
| Route mileage is higher than planned | Fuel, driving time, and labor can erode margin across the route | Delivery cost per machine and service efficiency | Map current routes and compare actual stop density to planned service intervals |
| Inventory shrink, spoilage, or product mix mismatch | Product losses and slow-moving items can reduce realized margin | Cost of goods sold and replenishment frequency | Compare inventory pulls, spoilage records, and item-level sales data |
Once these risks are documented, the final action checklist can turn the dashboard into a location-by-location review list: what to verify, what to update, and which assumptions need the most attention before you move to launch, acquisition, or funding prep.

What should a vending machine owner do next with the KPI dashboard?
The practical goal is simple: use the dashboard to decide which machines, locations, and routes deserve more capital, more service attention, or a clean exit. If the KPI view cannot connect revenue, stock turns, route mileage, repairs, commissions, and working capital to the bottom line, it is not yet decision-ready.
For a U.S. vending machine founder or buyer, the next step is to turn tracked metrics into a repeatable planning file that supports a launch, acquisition, or expansion decision. That means validating the machine-by-machine numbers, checking local assumptions, and comparing the route economics against your labor, fuel, inventory, and site-payment structure.
Readiness scorecard: is your plan ready for a buy, launch, or scale decision?
| Decision item | What to confirm | Why it matters |
|---|---|---|
| Machine-level revenue | Each unit’s sales are tracked separately, not blended into one route total. | Shows which machines carry the route and which ones may underperform. |
| Inventory and stock turns | You know what sells, how fast it moves, and how often restocking is needed. | Helps reduce waste, stockouts, and unnecessary cash tied up in product. |
| Route efficiency | Mileage, service time, and stop density are measured in a way you can compare. | Protects margin when fuel, labor, or drive time increases. |
| Repair and downtime history | Breakdowns, service calls, and parts costs are being captured consistently. | Supports replacement vs. repair decisions and avoids overestimating profit. |
| Site economics | Commissions, rent, or placement terms are documented for each location. | Site costs can change the economics of an otherwise strong machine. |
| Working capital coverage | You have enough cash to cover inventory, fuel, repairs, and slow-paying periods. | Prevents a profitable route from becoming a cash-flow problem. |
Next planning steps
- Separate KPI data by machine, location, and route instead of relying on blended totals.
- Compare gross revenue against inventory cost, commissions, repairs, and service mileage.
- Flag machines with weak sales, frequent service calls, or poor site terms.
- Test whether the route still works after realistic labor, fuel, and downtime assumptions.
- Update the plan if you are buying an existing route, adding machines, or seeking funding.
- Verify any local pricing, lease, permit, insurance, or vendor-term assumptions with current sources.
Final takeaway: A useful vending KPI dashboard does not just report performance; it helps you decide which machines and routes are worth keeping, fixing, or scaling.


