
Vending Machine Scheduling Model: Labor, Demand, and Coverage
A practical U.S. planning guide for vending machine scheduling model: labor, demand, and coverage, built for founders, buyers, and operators comparing assumptions before committing capital.


How should a vending machine scheduling model balance labor, demand, and coverage?
For a U.S. vending machine founder or buyer, the scheduling model should answer one practical question: can your route coverage keep machines stocked, serviced, and working without consuming more labor and mileage than the locations can support?
The model is not just a calendar. It ties demand patterns, restock frequency, repair response, route distance, and service standards to labor hours and working capital. If those inputs are off, the route can look profitable on paper but fail in day-to-day execution.
Before you lock staffing or launch timing, separate what you know from what must be verified locally: location traffic, store access rules, commission terms, vending machine mix, supplier lead times, repair support, and any permits or insurance requirements that affect operations.
| What the reader is deciding | What must be verified locally |
|---|---|
| How many routes, stops, and service days the operation can support | Location access windows, travel distances, machine count, and replenishment needs |
| How much labor the route requires | Loading time, restocking time, cleaning time, repair time, and delivery workflow |
| Whether the coverage plan matches demand | Sales variability by site, product turnover, seasonality, and empty-slot risk |
| Whether the operation is financeable | Working capital needs, vendor terms, equipment lead times, and lender or investor expectations |
- Lease or placement terms and any site access constraints
- Equipment mix, age, reliability, and replacement timing
- Labor plan for stocking, cleaning, counting, and repairs
- Menu economics by machine and location type
- Permits, insurance, and other local operating requirements
- Working capital for inventory, fuel, parts, and shortfalls
- Funding readiness, including whether the assumptions are strong enough for a lender or pitch deck
Next, the practical framework breaks these assumptions into a workable scheduling model so you can compare coverage options, labor load, and route economics before committing.
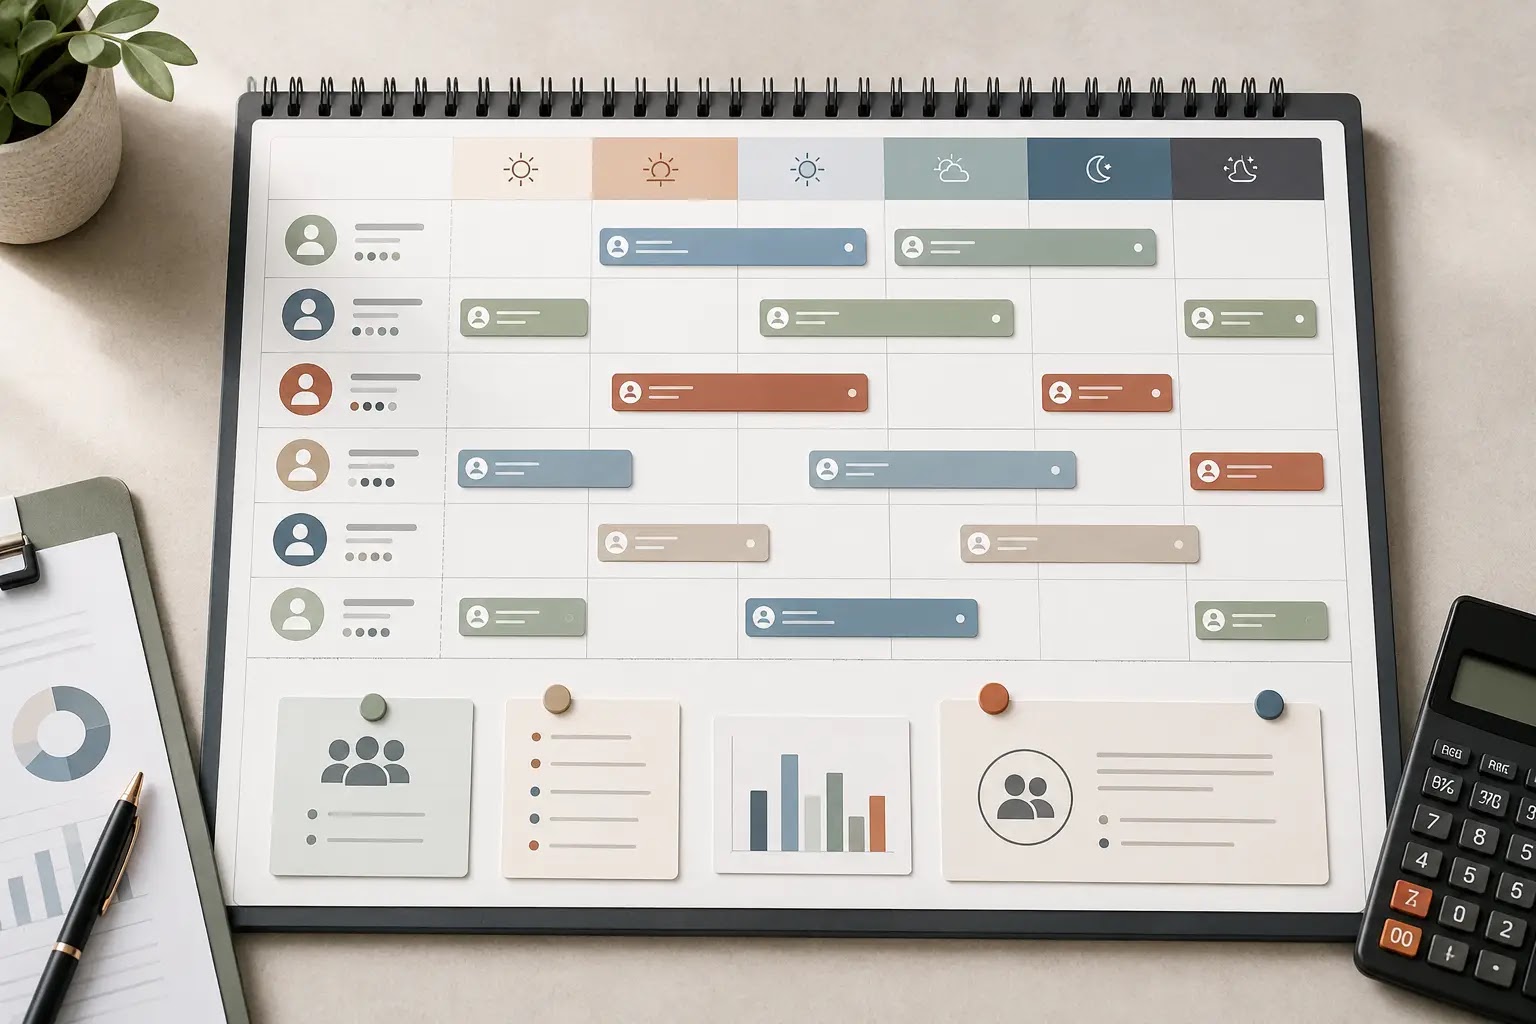
How should a vending machine scheduling model be built for labor, demand, and coverage?
Before you forecast margin, document the operating inputs that determine how often each machine needs service, how much route labor it consumes, and where coverage gaps can create lost sales, stockouts, or downtime.
What should be measured before you lock the route plan?
| Planning area | Question to answer | Input to collect | Model impact | Verification source |
|---|---|---|---|---|
| Machine count and geography | How many stops can one route realistically cover? | Number of machines, site addresses, travel distance, and clustering by area | Drives route length, labor hours, fuel, and coverage capacity | Account list, map route, mileage tracker, site roster |
| Sales velocity by machine | Which machines need the most frequent restocking? | Weekly or monthly unit movement by machine and SKU | Sets service frequency and inventory load per visit | Telemetry, manual count sheets, sales history, vendor reports |
| Product mix and shelf life | Which products create replenishment or waste risk? | Pack sizes, expiration limits, cold-chain needs, and fast-moving SKUs | Affects restock cadence, spoilage, and truck stock levels | Supplier specs, product labels, receiving logs |
| Service window and access | When can each location actually be serviced? | Allowed service hours, badge access, elevator use, loading rules, and site contact | Constricts route timing and may require split shifts | Location agreement, site manager confirmation, access instructions |
| Labor role split | Who handles restocking, cashless checks, cleaning, and minor repairs? | Role responsibilities, back-up coverage, and estimated task time per stop | Determines staffing needs and labor cost per route | SOP draft, time study, operator logs, contractor quotes |
| Repair and downtime risk | What happens when a machine fails between visits? | Common failure types, parts availability, response time, and repair escalation path | Impacts service reserve, lost sales risk, and technician coverage | Service records, technician availability, equipment warranty terms |
| Commission and site terms | Does the location add extra handling or reporting work? | Commission structure, reporting cadence, payment timing, and any site-specific requirements | Changes administrative labor and net revenue per machine | Signed agreement, invoice history, location owner confirmation |
| Inventory replenishment method | Do you refill from a warehouse, a van, or direct pickup? | Storage capacity, reorder lead times, supplier minimums, and truck stock limits | Shapes working capital, backroom space, and route frequency | Supplier quotes, inventory counts, storage plan, receiving records |
What is the practical workflow from research to documented assumptions?
- List every machine by location, machine type, and access window so the route map is built from actual stops, not estimates.
- Pull demand signals for each machine using sales history, manual counts, or telemetry to separate steady locations from erratic ones.
- Group machines by geography and service intensity so high-volume stops do not distort the entire route schedule.
- Estimate stop-level labor by task: restock, cashless reconciliation, cleaning, inventory count, and minor troubleshooting.
- Document which products require tighter replenishment control because of shelf life, temperature, or packaging constraints.
- Record route mileage, loading time, and site-access delays so travel labor is captured instead of hidden.
- Define the backup coverage plan for sick days, overflow routes, and breakdown response so service does not depend on one person.
- Write every assumption into a dated log with a source note, so the schedule can be reviewed, challenged, and updated later.
Once these operating assumptions are documented, the next step is to convert them into labor, mileage, inventory, downtime, and backup-coverage scenarios in the financial model.

How do labor, demand, and coverage change the financial plan?
What to test in the model
If your schedule is too thin, you may save labor but lose sales to stockouts, stale product, missed service windows, and slow repairs. If it is too heavy, coverage improves but route labor, mileage, and vehicle time can push the plan past break-even faster than expected.
The practical job is to connect each service cadence to a cost layer: labor hours, driving time, commissions or location fees, inventory turns, repair response time, software, spoilage, and the cash needed to keep machines filled while sales ramp.
Assumptions that usually move the result
- Average sales per machine by location type and daypart.
- Route density, drive time, and number of stops per shift.
- Labor coverage for stocking, cashless reconciliation, and service calls.
- Machine downtime, repair lead time, and restock frequency.
- Product mix, margin mix, spoilage risk, and vendor minimums.
- Commission, rent, or revenue-share terms tied to each location.
Simple planning calculator for break-even and funding need
| Metric | Simple planning formula | What to enter | Why it matters |
|---|---|---|---|
| Monthly operating load | Labor + mileage + software + commissions + repairs + spoilage + other overhead | Loaded labor cost, route mileage cost, subscription fees, location fees, and expected maintenance reserve | Shows the recurring cost of keeping machines serviced and covered |
| Break-even sales | Monthly operating load ÷ gross margin percentage | Use an updated gross margin assumption by product mix | Indicates the revenue level needed to cover fixed monthly costs |
| Cash runway | Starting cash reserve ÷ monthly net burn | Opening cash on hand and the expected monthly shortfall if sales lag | Helps size working capital for the early ramp period |
| Funding need | Total opening uses − verified sources of funds | Machine purchase or lease, inventory, deposits, route setup, software, repairs reserve, and working capital | Clarifies how much capital is still needed before launch or acquisition close |
Scenario check: what changes when coverage gets tighter or looser?
| Scenario | Coverage style | Likely cost effect | Likely service effect | Planning tradeoff |
|---|---|---|---|---|
| Lean coverage | Fewer visits, tighter route spacing | Lower labor and mileage | Higher stockout and delay risk | Can help cash flow early, but only if demand is predictable |
| Balanced coverage | Scheduled visits matched to sales volume | Moderate operating load | More stable fill rates | Often the best starting point for a new route model |
| High-touch coverage | More frequent service and faster repairs | Higher labor, driving, and overhead | Better availability and cleaner presentation | Can support premium locations if the extra sales justify the cost |
Risk checklist for the financial model
- Do not assume every machine will sell at the same rate; location mix usually drives route efficiency.
- Do not treat labor as only stocking time; include drive time, reconciliation, cleaning, and repair coordination if they are part of the role.
- Do not ignore commission terms, revenue shares, or minimum guarantees when they apply to a site.
- Do not understate cash needs for inventory, equipment downtime, or slow-paying locations.
- Do not rely on generic margin assumptions if your product mix includes mixed snack, drink, or cashless payment costs that differ by location.
Vendor terms and local verification matter
Machine pricing, service contracts, supplier minimums, payment processing terms, commissions, lease terms, insurance requirements, permit rules, and financing conditions vary by market and vendor. Replace every placeholder in the model with current quotes, current local requirements, and verified data before using it for a lease, purchase, funding pitch, or launch decision.
What to verify next
- Confirm route mileage, travel time, and service frequency with a real route map.
- Gather current supplier quotes for the product mix you plan to stock.
- Test break-even sales under low, expected, and high demand cases.
- Size the working capital reserve for the slowest plausible early ramp.
- Update the model before you use it in a pitch deck or lender conversation.
Planning note: A business plan, financial model, pitch deck, checklist, and startup toolkit can help keep these assumptions organized and ready for partners, landlords, lenders, or advisors.

What should you do next to turn the scheduling model into an operating plan?
Practical recap: the scheduling model only works if labor, demand, route coverage, and maintenance are planned together. For a U.S. vending machine founder or buyer, the decision is not just “how often to visit a location,” but whether the route can be staffed, stocked, and serviced consistently enough to protect sales and reduce missed refills, out-of-stock issues, and avoidable downtime.
Before you commit, verify the local inputs that drive the schedule: number of machines, machine mix, product turns, route mileage, service windows, repair response time, commissions, and the staffing setup you can actually support.
Readiness scorecard: are the assumptions complete enough to plan?
| Checkpoint | What to confirm | Planning impact |
|---|---|---|
| Machine count and locations | How many machines you will service and where they are clustered | Drives route density, travel time, and staffing need |
| Demand pattern | Which locations refill fastest and which sell unevenly | Affects visit frequency and inventory loadout |
| Service standard | Your target for restock timing, cleanliness, and issue response | Sets labor hours and coverage expectations |
| Repair and downtime plan | Who handles jams, card reader issues, and machine failures | Influences spare parts, vendor terms, and reserve labor |
| Route economics | Fuel, mileage, labor, commissions, and inventory handling | Determines whether the route is profitable at current scale |
| Working capital | Cash available for inventory, repairs, and slow-collection timing | Supports launch stability and reduces service gaps |
Next-step checklist
- List every machine, location, and expected service window.
- Estimate route time, mileage, and labor coverage by day or by week.
- Separate regular restocking visits from repair and exception handling.
- Document the inputs that change demand by season, site type, or payment mix.
- Test whether your staffing plan still works if one route runs long or a machine goes down.
- Verify commission terms, vendor lead times, and local operating costs with current sources.
- Update the cash plan so inventory and maintenance needs do not outrun working capital.
Final takeaway: the best vending schedule is the one that matches real demand, route geography, and your ability to staff coverage without breaking the cash plan. If the model looks thin, adjust the route, the service standard, or the staffing plan before launch—not after missed refills start hurting sales.


