
Vending Machine Premium vs Budget Positioning
A practical U.S. planning guide for vending machine premium vs budget positioning, built for founders, buyers, and operators comparing assumptions before committing capital.

Vending Machine Premium vs Budget Positioning: which choice fits the location and the margin?
Quick decision frame
| What the reader is deciding | What must be verified locally |
|---|---|
| Whether the route should use a premium mix, a budget mix, or a blended offer based on the site’s traffic, customer expectations, and pricing tolerance | Location type, foot traffic pattern, customer segment, landlord commission terms, equipment condition, restocking distance, product costs, and current vendor terms |
If you are choosing between premium snacks, drinks, or specialty items and a simpler budget lineup, the real question is whether the location can support the higher product cost, service expectations, and price point. Premium positioning can work when the site values convenience, quality, or selection; budget positioning can fit price-sensitive or high-turnover locations where simplicity matters more.
For U.S. vending businesses, the decision usually turns on route economics, not branding alone. Two machines with similar sales potential can produce very different results once commissions, spoilage, repairs, payment hardware, and restocking frequency are included.
The best first pass is to separate what you want to sell from what the location will actually bear. That keeps startup, acquisition, and funding discussions grounded in assumptions you can verify before you commit inventory or sign a site agreement.
- Lease and buildout: site access, placement constraints, and any location-specific fit-out needs.
- Equipment: machine type, age, reliability, cashless payment setup, and serviceability.
- Labor: route time, stocking frequency, and repair response time.
- Menu economics: product cost, price tolerance, shrink, spoilage, and margin mix.
- Permits and local requirements: market-specific rules that vary by city, county, and state.
- Working capital: inventory, spare parts, fuel, and cash buffer for early route volatility.
- Funding readiness: whether your assumptions are clear enough for a lender, landlord, partner, or buyer review.
Next, the practical framework breaks these assumptions into the local inputs that actually change the premium-versus-budget decision.
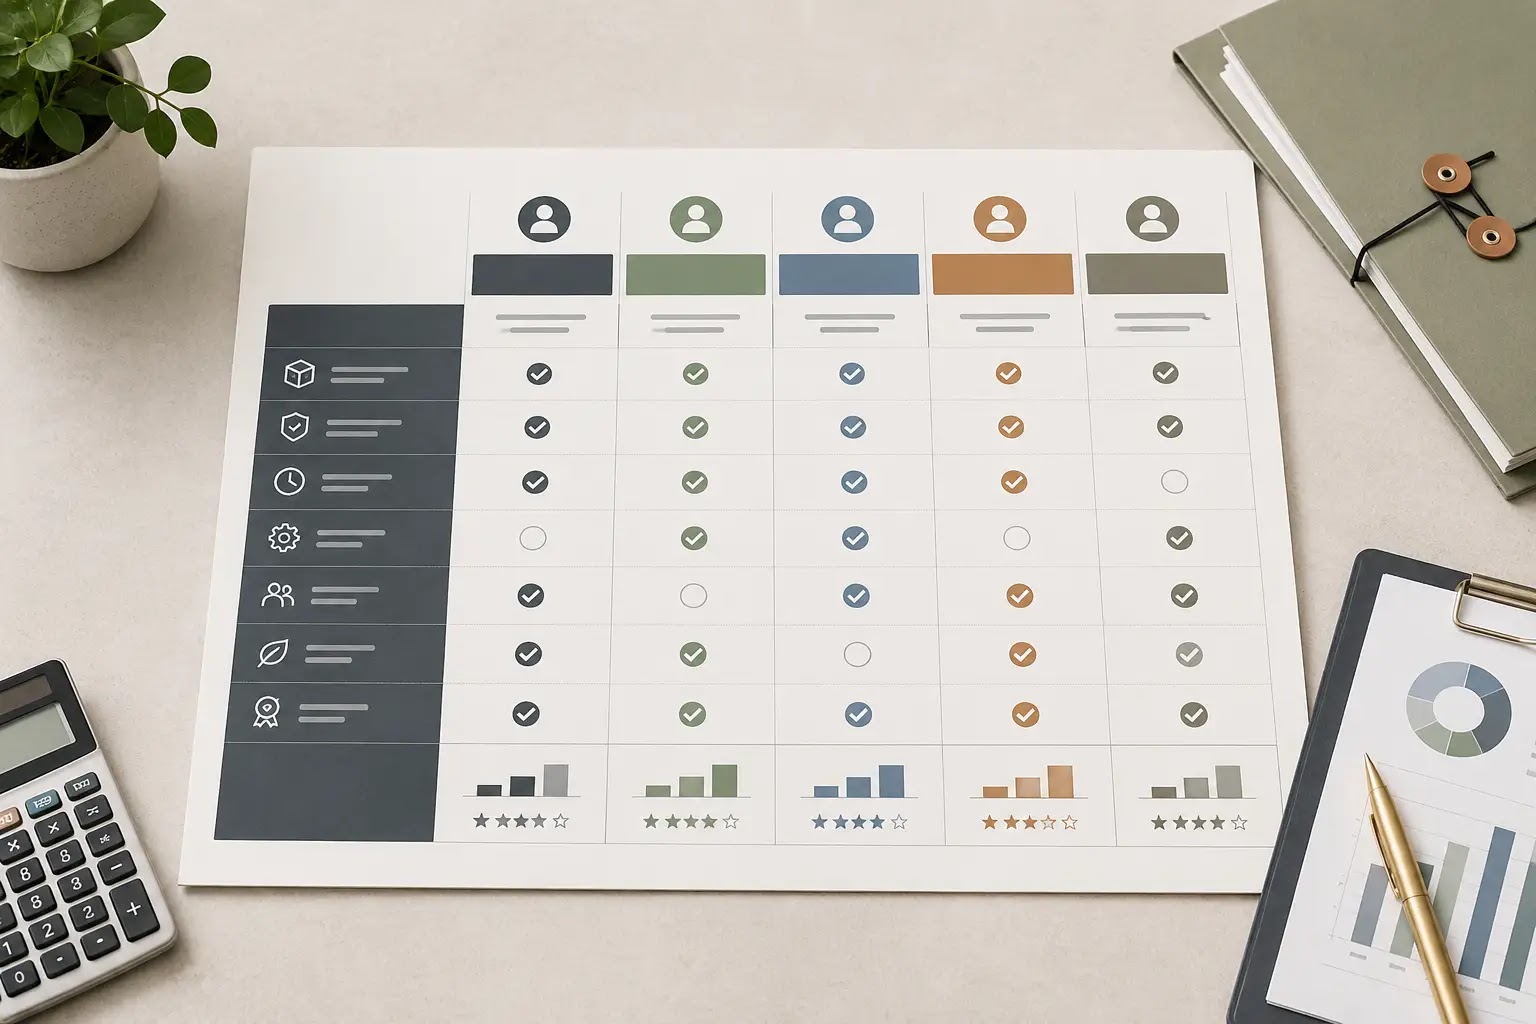
How should a vending machine founder compare premium vs budget positioning?
The practical framework: premium and budget positioning should be decided by the same local variables: what the location audience will actually buy, how often product turns, what the host expects, and whether higher-priced items create enough gross profit after commissions, spoilage, route time, and restocking frequency. In vending, the “right” menu is usually the one that fits the location’s purchase behavior, not the one with the widest assortment.
What inputs matter before you choose the product mix?
For U.S. vending startup and acquisition planning, the menu, product, and pricing decision should be built from site-level evidence. A premium mix can work in the right locations, but it usually needs stronger conversion, cleaner presentation, and tighter inventory control. A budget mix may move faster in some sites, but it can also compress margin if commissions, labor, and refill trips are high.
| Planning area | Question to answer | Input to collect | Model impact | Verification source |
|---|---|---|---|---|
| Location audience | Who is buying here, and what do they already expect to pay? | Site type, buyer profile, traffic pattern, time of day, stay duration | Drives price ceiling, package size, and product tier | Site walk, host interview, observation, nearby competitor pricing |
| Purchase behavior | Does the site favor convenience, value, or premium impulse buys? | Observed item preferences, top-selling categories, refill history if existing | Affects SKU mix, facings, and planogram priority | Existing machine sales data, operator records, location manager feedback |
| Product cost structure | Can the menu support the target margin after wholesale cost and spoilage? | Current supplier quotes, case pack sizes, expiration profile, loss assumptions | Sets gross margin range and reorder cadence | Distributor quotes, invoices, sample orders, product shelf-life review |
| Commission or location share | Does the location take a percentage, flat fee, or no share? | Host terms, placement agreement, commission structure | Changes net margin by site and may favor higher-ticket items | Signed agreement, proposal, landlord or host discussion |
| Route efficiency | How many trips does the mix create, and can you service it efficiently? | Distance, stop density, refill frequency, labor time per stop | Impacts labor, mileage, and the attractiveness of slower-moving premium SKUs | Route map, travel log, estimated service schedule |
| Equipment fit | Does the machine format support the product price point? | Spiral capacity, refrigerated space, age/condition, cashless support | Affects product range, uptime, and maintenance risk | Machine spec sheet, inspection, vendor service history |
| Pricing logic | Is the machine priced to match the site and product tier? | Target price bands by SKU, change/cashless settings, package size | Influences conversion rate and average ticket | Competitor checks, test pricing, historical sales by item |
| Inventory risk | Will premium SKUs sit too long or create waste? | Turn rate assumption, spoilage risk, shrink risk, min/max stock levels | Changes working capital needs and net margin volatility | Supplier shelf-life data, pilot sales, prior route performance |
What workflow turns market research into documented assumptions?
- Map the site type first. Separate locations by audience and buying context: office, apartment, school-adjacent, warehouse, gym, hospital, hotel, or other high-traffic setting.
- Record the menu pattern you expect the site to support. Note whether the site is likely to reward value snacks, better-for-you items, premium drinks, hot items, or a limited hybrid mix.
- Collect local price references. Check nearby vending machines, convenience stores, and in-building options so your price bands reflect the real competitive set.
- Request current supplier quotes. Compare case costs, minimum order sizes, delivery terms, and product freshness so the mix is based on actual input costs, not estimates.
- Translate the menu into a planogram. Document which SKUs get priority, which are test items, and which are only added if the machine and location can support them.
- Estimate route impact. Ask whether the mix will increase restock trips, require colder storage, create heavier loads, or add repair sensitivity.
- Define the pricing rule by tier. Write down when you would price for volume, when you would price for margin, and when the host or audience makes one approach clearly better.
- Set a review trigger. Decide in advance what sales pattern, spoilage level, or restock burden would cause you to shift from premium to budget, or the reverse.
Verification note: pricing, supplier terms, equipment fit, and host expectations vary by market and by site. Treat this framework as an assumption document, then verify it with current local quotes, location discussions, and on-site observation before you lock the product mix.
Use this framework to document the menu and pricing logic before you build the numbers. The next block translates those assumptions into financial model implications, tradeoffs, and risk checks.
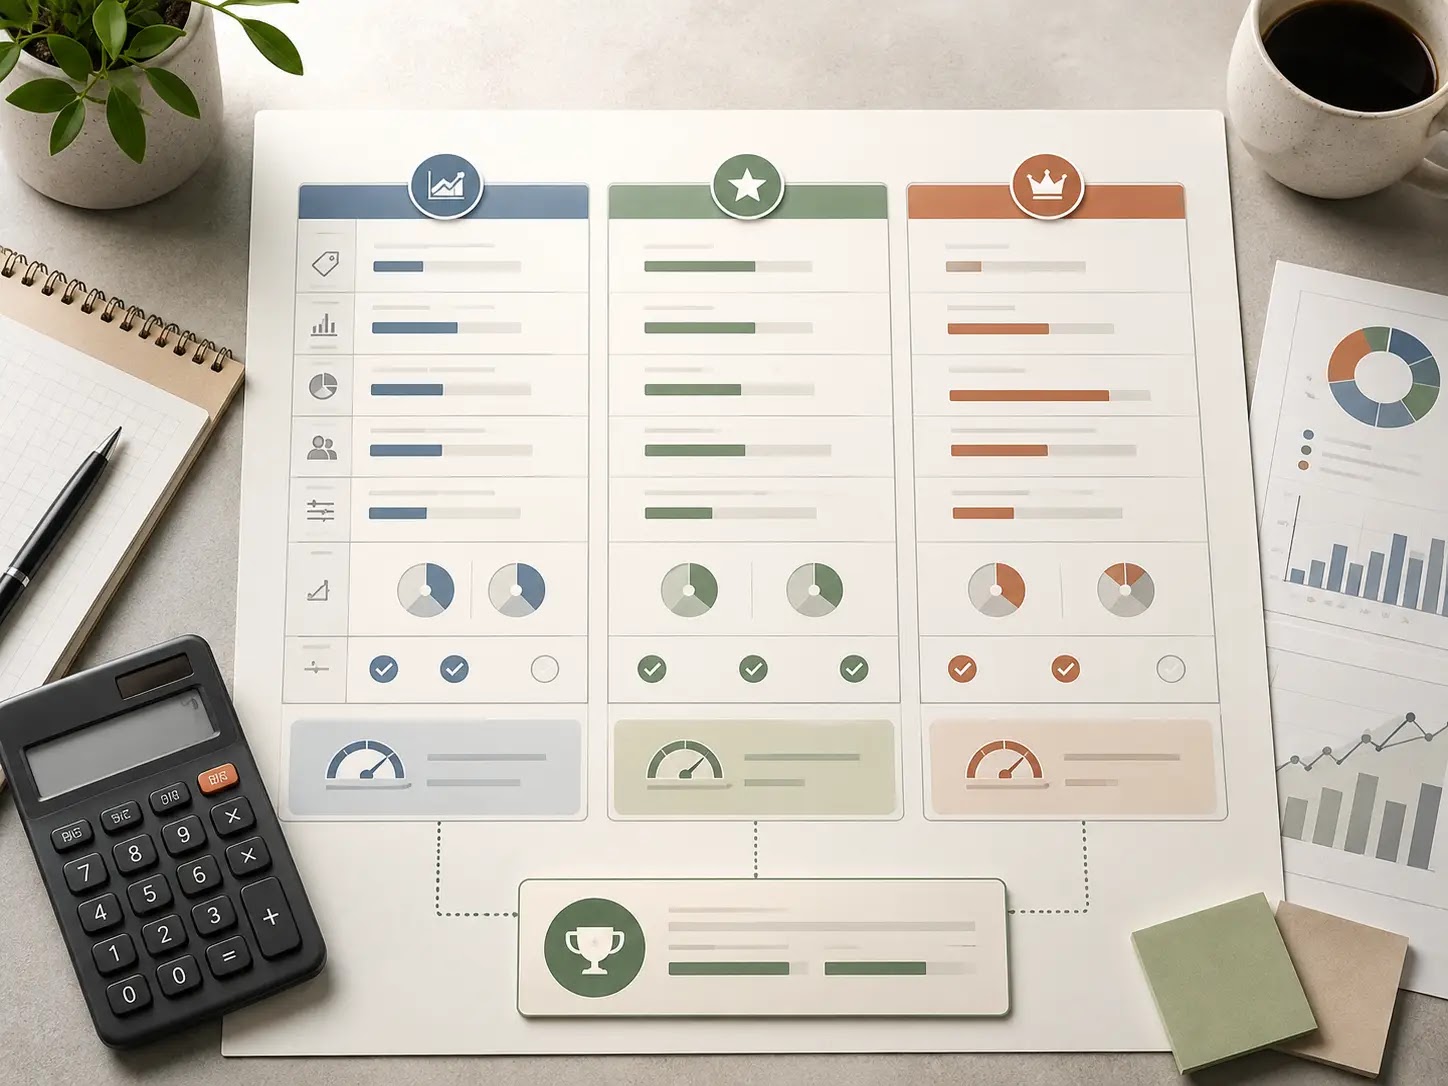

What should you do next if premium vs budget vending is still undecided?
If the location can support stronger perceived value, better service expectations, and a higher-touch assortment, premium positioning may fit. If the site is more price-sensitive, turnover is the main goal, and you need simpler replenishment and tighter startup discipline, budget positioning may be the safer first pass.
The practical decision path is the same either way: verify the location economics, pressure-test the product mix against spoilage and service time, estimate route mileage and labor, then see whether commissions, repairs, software, and working capital still leave room for margin.
| Decision item | What “ready” looks like | Why it matters |
|---|---|---|
| Location fit | You have a clear view of the site’s customer profile and price sensitivity. | Positioning should match the buyer, not the operator’s preference. |
| Unit economics | You know how commissions, restocking labor, repairs, and spoilage affect each scenario. | Margin can disappear even when sales volume looks acceptable. |
| Operating capacity | You can support the route mileage, service frequency, and inventory complexity the concept requires. | Premium assortments often need more careful control; budget setups may rely on efficiency. |
| Capital readiness | You have planned for machine purchase, initial inventory, software, maintenance, and working capital. | The better concept on paper can still strain cash if launch reserves are too thin. |
Planning note: If you are building this decision into a business plan, financial model, pitch deck, checklist, or startup toolkit, the goal is to document assumptions clearly enough for partners, lenders, landlords, or advisors to review the same scenario set.
Next-step checklist
- Confirm the target location’s customer mix and likely price sensitivity.
- Compare premium and budget assortments using the same route, labor, and commission assumptions.
- Estimate machine cost, inventory depth, refill frequency, and spoilage risk for each option.
- Map repair exposure and software needs to the level of complexity you can actually operate.
- Test whether projected cash flow still supports working capital after startup expenses.
- Choose the positioning that best fits the site economics, not just the highest gross margin story.
Final takeaway: for a U.S. vending machine founder or buyer, the best premium vs budget choice is the one that matches local demand, operating capacity, and cash requirements with the least guesswork.


