
Vending Machine Financial Model Inputs Founders Should Verify
A practical U.S. planning guide for vending machine financial model inputs founders should verify, built for founders, buyers, and operators comparing assumptions before committing capital.

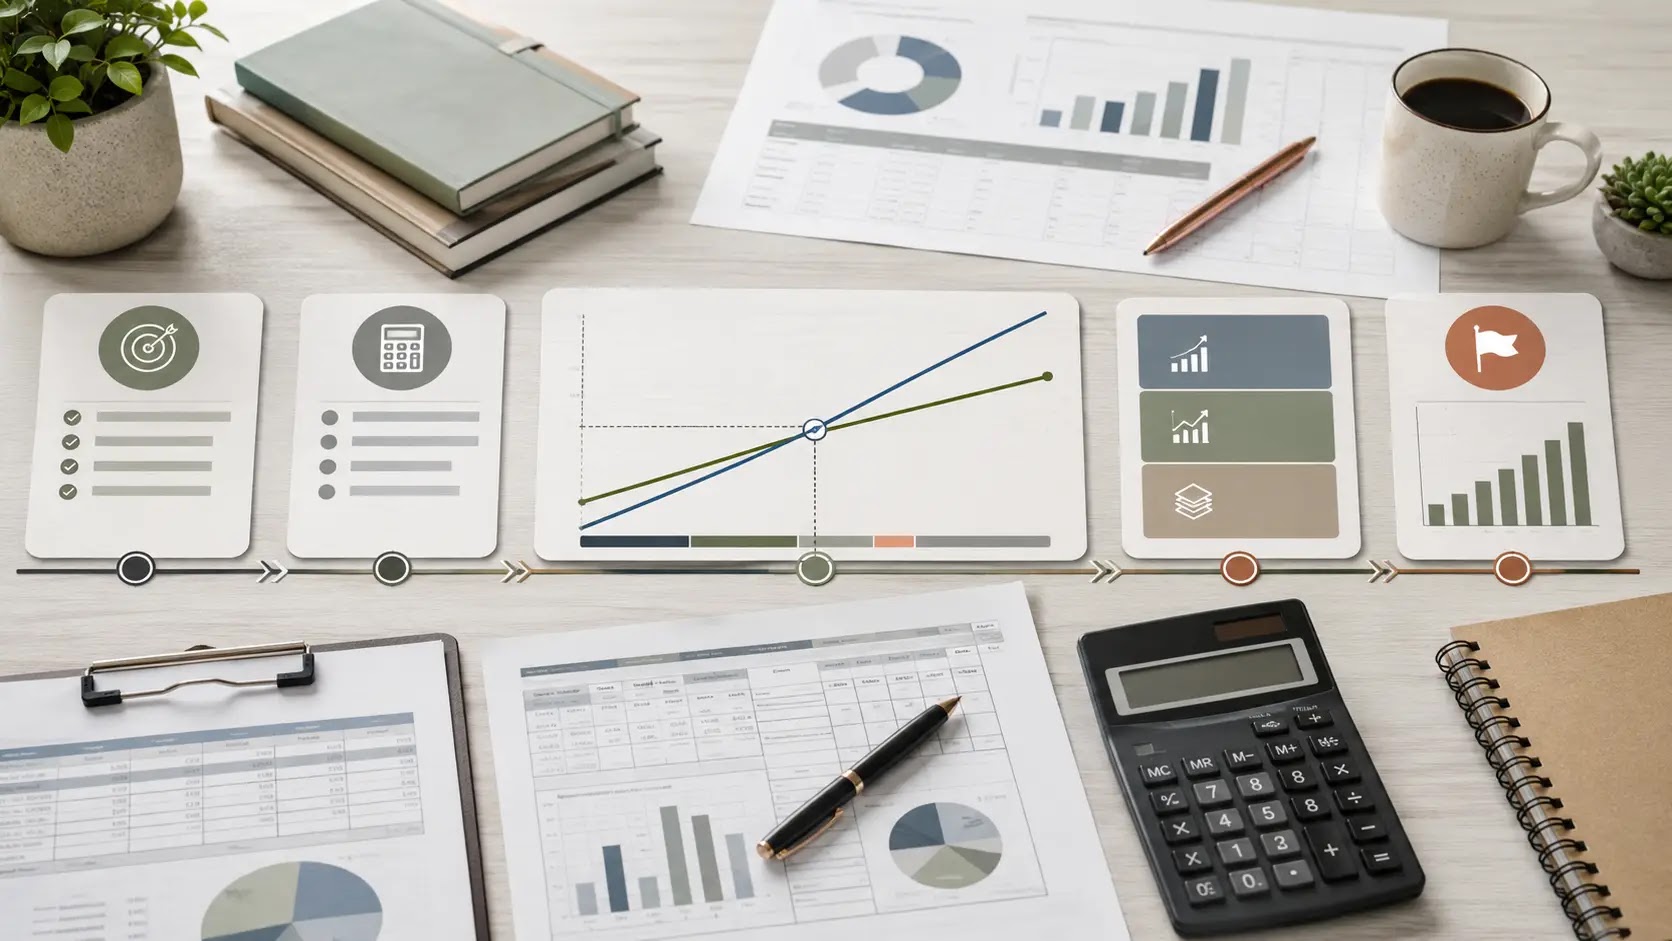
Which vending machine financial model inputs should founders verify first?
If you are buying, funding, or launching a vending machine business, the model is only useful when the local inputs are real. The biggest question is not whether vending can work in theory; it is whether your locations, machine costs, product mix, route density, and operating terms support the margins you are expecting.
For a U.S. vending business, the financial model should be built around machine-level revenue, inventory cost, commissions or location fees, maintenance, route mileage, and working capital. Those inputs vary by market, property type, and vendor terms, so the right answer depends on what you can verify before you commit capital.
Buyers should treat this as a diligence exercise: verify the assumptions that drive owner earnings, break-even timing, and cash needs before you rely on any forecast, lender conversation, or pitch deck.
| What the reader is deciding | What must be verified locally |
|---|---|
| Can this route or startup generate acceptable owner earnings? | Machine traffic, item pricing, product mix, commissions, and maintenance frequency |
| How much capital is needed to open or acquire it? | Equipment pricing, inventory, buildout, service tools, software, and working capital needs |
| Is the business scalable or too thin to support growth? | Route density, refill labor, mileage, downtime, and location access terms |
- Lease and buildout: site access, space fit, power, delivery path, and any location-specific costs
- Equipment: machine price, age, reliability, refurbishment needs, and spare parts exposure
- Labor: restocking time, service frequency, route density, and owner-operator time
- Menu economics: product cost, shrink, pricing, category mix, and sell-through by location
- Permits and site requirements: local rules, approvals, and any location-level restrictions
- Working capital: cash needed for inventory, repairs, fuel, and timing gaps between restocks and collections
- Funding readiness: documentation clarity for lenders, partners, or an acquisition review
The rest of the analysis should be built from those verified inputs, not from generic industry assumptions. Next, the practical framework shows which model inputs matter most and how to organize them without overbuilding the forecast.

What should a vending machine financial model verify before the numbers are usable?
For a U.S. vending machine route, the first job is to replace “average machine” guesses with documented route and unit inputs. The model only becomes decision-ready when the founder has verified location terms, machine mix, sales evidence, route mileage, refill labor, commissions, repairs, software, and working capital timing.
Which route and unit inputs deserve the first round of verification?
| Planning area | Question to answer | Input to collect | Model impact | Verification source |
|---|---|---|---|---|
| Placement economics | What does each location actually charge or share? | Placement fee, commission rate, utility charge, access limits, and any required service windows | Gross margin per stop and net route profitability | Signed location agreement, landlord or site contact, written vendor terms |
| Machine mix | How many machines of each type are on the route? | Count by machine type, age, condition, capacity, and any planned replacements | Startup capex, maintenance needs, refill cadence, and downtime risk | Asset list, inspection notes, seller records, equipment photos |
| Sales per machine | What are actual sales at the machine or location level? | Machine-level sales history, seasonal pattern, daypart pattern, cash vs card mix | Revenue, inventory turns, cash collection cadence, and break-even timing | Telemetry, POS reports, bank deposits, historical route logs |
| Route density and mileage | How much driving and service time does the route require? | Stop count, miles, drive time, refill frequency, route clustering, and parking/access friction | Fuel, labor, owner time, and the number of stops a route can support | Map review, field drive test, route plan, technician schedule |
| Inventory and product mix | Which products move, and what do they cost delivered? | SKU mix, case cost, minimum order size, spoilage or shrink exposure, and supplier lead time | COGS, gross margin, cash tied up in inventory, and stockout risk | Distributor quotes, invoices, shelf checks, replenishment history |
| Repairs and uptime | How often do machines need service or repair? | Maintenance history, parts list, technician access, expected repair reserve, and replacement timing | Operating expense, lost sales from downtime, and capex planning | Inspection report, service logs, technician quote, seller disclosures |
| Payment and software stack | What does it cost to collect and reconcile sales? | Card processing terms, software subscription, telemetry fees, cash handling process | Payment expense, reporting quality, and reconciliation workload | Processor statement, software proposal, vendor contract |
| Working capital | How much cash is needed to keep the route stocked and responsive? | Inventory reorder timing, spare parts balance, cash collection lag, and purchase cadence | Funding need, liquidity buffer, and expansion pace | Supplier terms, bank timing, purchase records, inventory counts |
| Acquisition normalization | If buying a route, what history is actually transferable? | Seller-reported performance, assignment terms, customer concentration, machine transfer status | Revenue ramp, retention risk, and owner earnings adjustments | Seller P&L, machine-by-machine records, assignment documents, direct confirmations where available |
How do founders move from research to documented assumptions?
- List every route stop, machine type, and placement as a separate line item instead of blending the route into one average.
- Collect machine-level sales evidence where available, then flag any seller-reported figures that still need outside support.
- Record each location’s commission, rent, utility charge, access hours, and service obligations before forecasting margin.
- Measure route miles, drive time, stop density, and refill frequency so labor and fuel assumptions reflect the actual service pattern.
- Pull current supplier, parts, card processing, and software terms so inventory and payment costs are based on active vendor quotes.
- Document repair history, downtime patterns, and replacement timing for older machines or higher-friction locations.
- Separate startup, acquisition, and expansion assumptions so the model can compare route scenarios without mixing them together.
- Tag each assumption with a source, date, and owner so the model can be reviewed by lenders, partners, or advisors later.
With these inputs documented, the next section can translate them into revenue, margin, owner earnings, and break-even scenarios without letting unsupported assumptions drive the result.
How should founders stress-test vending machine economics before they buy or launch?
For a U.S. vending machine business, the model usually becomes fragile or strong based on a few inputs: machine utilization, product mix, route mileage, labor coverage, commissions or location fees, repairs, and working capital. A good underwriting case does not assume those inputs; it verifies them with current quotes, site data, and realistic service assumptions.
The main tradeoff is simple: higher revenue potential often comes with more stops, more replenishment, more shrink risk, and more uptime dependency. Lower-touch locations may be easier to run but can require weaker pricing power or lower sales per machine.
What usually moves the model fastest?
- Sales per machine by location type, daypart, and traffic pattern
- Product cost changes from brand mix, case-pack pricing, and spoilage
- Route miles, fuel, and service time per stop
- Repairs, telemetry/software, card fees, and cash handling costs
- Location commissions, rent splits, or revenue-share terms
Assumptions that deserve current verification
- How many machines are actually deployable in the first 30 to 90 days
- Whether the same site can support the expected sales mix over time
- How often a route stop is needed to avoid stockouts
- How much cash reserve is needed for slow onboarding and repair lag
Simple planning calculator: which inputs should you verify first?
| Input to verify | Illustrative placeholder | Model impact | What to confirm |
|---|---|---|---|
| Machines deployed | Initial active unit count | Drives total sales, service load, and startup funding need | Accepted placements, delivery timing, and installation readiness |
| Sales per machine | Average monthly gross sales per unit | Sets revenue, break-even speed, and cash runway | Comparable locations, traffic, and refill frequency |
| Product cost rate | COGS as a share of sales | Determines gross margin and pricing flexibility | Vendor quotes, pack sizes, spoilage, and shrink |
| Route operating cost | Fuel, mileage, labor, and time per stop | Affects owner earnings and route efficiency | Stop count, route density, and staffing plan |
| Repairs and downtime | Maintenance reserve per machine | Reduces usable sales days and raises cash needs | Machine age, parts access, and service response time |
| Commissions or site fees | Fixed fee or revenue share | Directly lowers contribution margin | Signed terms, renewal language, and billing method |
| Working capital reserve | Cash buffer for ramp-up and surprises | Determines survival during slow starts or repairs | Inventory cycle, pay terms, and debt service timing |
Scenario view: how assumptions change the decision
| Scenario | Sales assumption | Cost pressure | Planning implication |
|---|---|---|---|
| Conservative | Lower verified sales per machine | Higher repair, fuel, or commission load | Needs more cash reserve and a slower payback case |
| Base case | Midpoint based on similar verified sites | Normal service and product mix | Use for lender, buyer, or partner discussions |
| Upside | Best realistic sales at strong locations | Lower downtime and efficient routing | Useful for upside, not for funding readiness alone |
Quick sensitivity checklist
- If sales per machine fall, re-check break-even sales and funding need.
- If route mileage rises, re-check labor coverage and fuel assumptions.
- If commissions increase, re-check gross margin and site-level viability.
- If downtime is higher than expected, re-check inventory and repair reserves.
- If debt payments start before full ramp-up, re-check cash runway.
What to verify with vendors, owners, and local sources
- Ask equipment sellers for condition, age, payment terms, and any service history available.
- Ask location owners how commissions, access hours, stocking rules, and renewal timing work.
- Ask distributors for current case pricing, minimum orders, lead times, and substitutions.
- Ask service providers what repair response times and parts availability look like in your area.
- Ask local advisors what permits, registrations, or operational requirements may apply in your market.

What should you verify next before you call the vending model decision-ready?
The practical path is simple: verify the location-level revenue drivers, stress-test route costs, and confirm the working capital needed to keep machines stocked and serviced. If the model still works after commissions, repairs, spoilage, fuel, software, and slow-moving locations are included, you have a more credible basis for a startup, acquisition, or funding discussion.
| Readiness item | What to confirm | Why it matters |
|---|---|---|
| Location assumptions | Site count, foot traffic pattern, and any host commission or revenue share | Drives revenue and net margin more than the machine itself |
| Route economics | Mileage, service frequency, and how many stops fit into a route | Changes labor, fuel, and time per refill |
| Inventory cycle | Product mix, restock timing, and cash tied up in inventory | Determines working capital needs and cash conversion timing |
| Maintenance assumptions | Expected repair cadence, parts replacement, and machine downtime | Affects owner earnings and service reliability |
| Software and admin | Telemetry, payment processing, accounting, and reporting inputs | Supports collection tracking and route oversight |
| Financing structure | Down payment, debt service, and any lease or equipment terms | Influences break-even and early cash flow |
Next planning steps
- Collect current quotes or vendor terms for machines, parts, and payment hardware.
- Document each target location’s revenue assumption and any commission or fee structure.
- Estimate route mileage, labor time, and refill frequency by region.
- Build downside, base, and upside cases using conservative sales assumptions.
- Map working capital for inventory, repairs, and the first operating months.
- Verify local lease terms, insurance requirements, and market-specific costs with current sources.
Final takeaway: a vending machine deal is only as strong as the assumptions behind each location, route, and refill cycle—verify those inputs before you commit capital or sign a lease.


