
Vending Machine Back-of-House Planning for Better Margins
A practical U.S. planning guide for vending machine back-of-house planning for better margins, built for founders, buyers, and operators comparing assumptions before committing capital.

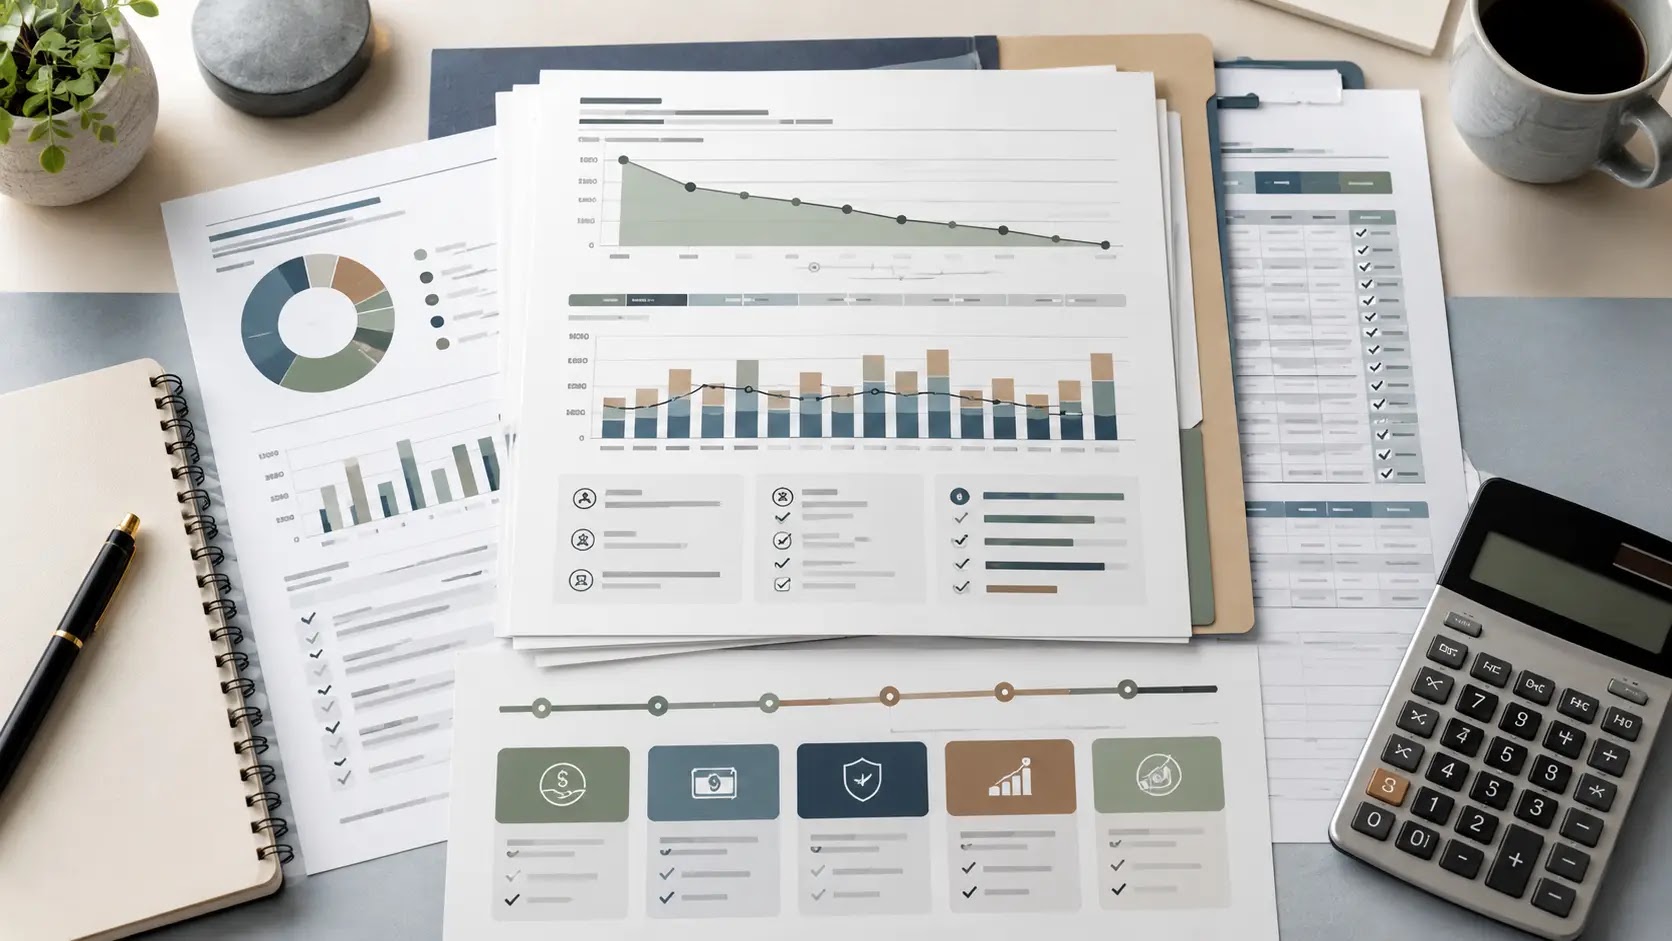
How should you plan vending machine back-of-house operations for better margins?
If you are buying a route, opening a new territory, or financing a vending machine startup, the margin question is not just “Will the machines sell?” It is whether the back-of-house plan supports profitable service trips, acceptable downtime, and enough working capital to keep inventory moving.
For most operators, the practical drivers are route density, machine mix, refill frequency, spoilage or shrink, commissions, equipment repairs, software, fuel, and labor. Those inputs change by market and by location, so the right answer depends on local lease terms, vendor pricing, service expectations, and the actual stop list you can operate.
That is why the first planning step is to separate the operating idea from the local assumptions that can move margins up or down. A route that looks efficient on paper can become expensive if stops are spread out, the product mix is wrong for the site, or the machines need more maintenance than expected.
| What the reader is deciding | What must be verified locally |
|---|---|
| Whether the route can support acceptable margins | Stop density, travel time, commission terms, spoilage risk, and refill cadence |
| Whether the machine mix fits the territory | Location demand, equipment condition, product categories, and service requirements |
| Whether the launch or acquisition is financially ready | Inventory needs, repair reserve, working capital, software costs, and financing terms |
Which assumption categories matter most?
- Lease or placement terms for each location
- Equipment condition, age, and repair exposure
- Labor time, route mileage, and service frequency
- Menu economics, including price mix and product turnover
- Permits, site permissions, and local operating requirements
- Working capital for inventory, maintenance, and cash flow gaps
- Funding readiness if you are buying or expanding a route
With those assumptions identified, the next step is to map them into a practical planning framework so you can compare startup, acquisition, and expansion options on the same operating logic.
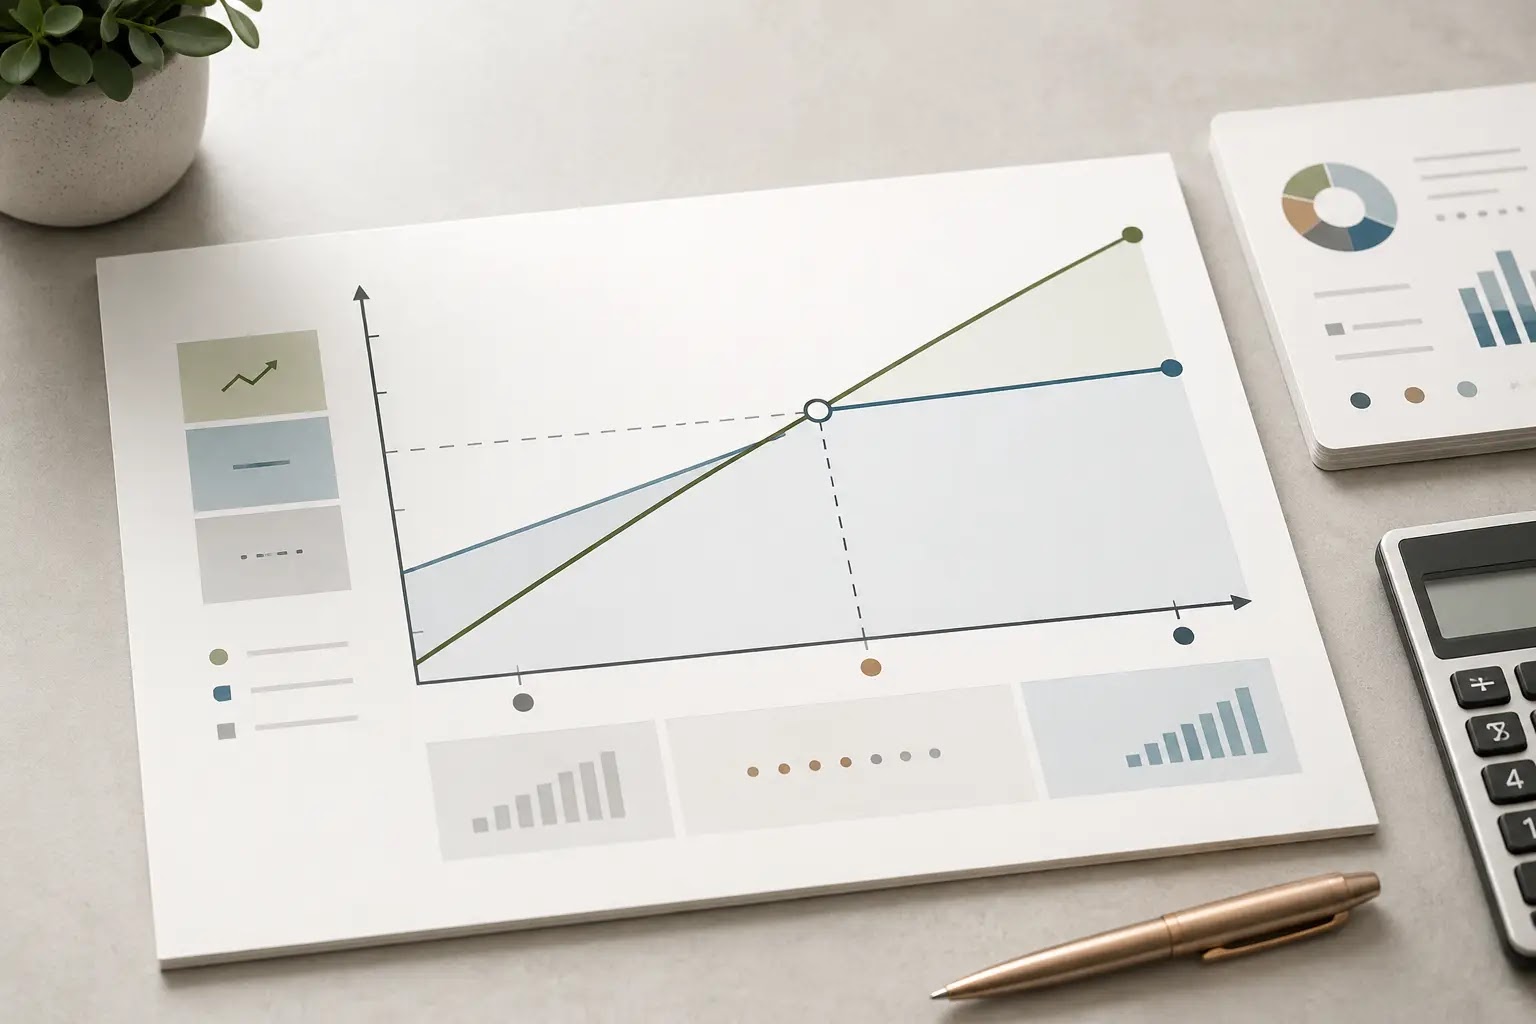
How do you turn route and territory research into margin-focused operating assumptions?
For a vending machine founder or buyer, back-of-house planning starts with the route, not the machine count. The goal is to document which locations can be served efficiently, what each stop costs to keep stocked, and which territory patterns support cleaner margins after drive time, commissions, product handling, repairs, and software.
That means treating each prospective stop as an operating unit: access, refill cadence, inventory mix, and service burden all affect gross margin and working capital before a single machine is installed.
What should you verify before you commit to a territory?
| Planning area | Question to answer | Input to collect | Model impact | Verification source |
|---|---|---|---|---|
| Territory density | Can stops be clustered tightly enough to reduce dead mileage? | Candidate locations, addresses, drive times, route map | Labor time, fuel, route efficiency, service coverage | Mapping tools, site visits, operator interviews |
| Back-of-house access | Can the machine be serviced during practical loading windows? | Loading doors, elevator access, dock rules, access hours | Visit length, schedule flexibility, missed-service risk | Host discussion, facility manager, site walkthrough |
| Refill cadence | How often will each machine need restocking based on sales and capacity? | Estimated sales, machine capacity, product mix, par levels | Inventory holding, labor hours, stockout risk | Comparable routes, pilot data, machine specs |
| Host economics | What commission, rent, or location fee is tied to the placement? | Proposed split, fee structure, responsibility for utilities or upkeep | Net revenue per stop, break-even threshold | Draft location agreement, host proposal, vendor terms |
| Product assortment | Which SKUs fit the audience and reduce waste or slow-moving inventory? | Location profile, package sizes, historic sales mix if available | Gross margin, spoilage, cash tied in inventory | Comparable accounts, supplier catalog, test orders |
| Service burden | Which sites are likely to create repair calls, jams, or payment issues? | Machine type, age, payment system, maintenance history | Downtime, repair expense, service reserve | Equipment records, inspection, technician feedback |
| Payments and software | Will cashless tools and route software justify the added fee? | Processing terms, software features, reconciliation process | Collection efficiency, reporting accuracy, admin time | Vendor demo, contract terms, operator references |
How should a founder move from research to documented assumptions?
- Map the territory first. Group candidate stops by neighborhood, facility type, and drive-time cluster before estimating sales.
- Score each stop for route practicality. Record access hours, loading constraints, security concerns, and any back-of-house rules that affect service time.
- Estimate service frequency by machine type. Compare expected demand to capacity so your restock assumptions reflect actual refill cadence, not a generic schedule.
- Collect host terms in writing. Document commissions, rent, utility responsibility, maintenance expectations, and any other location-level costs.
- Build a product plan for each location type. Tie the assortment to audience fit, shelf capacity, and spoilage risk instead of using one universal SKU list.
- Estimate route labor and travel inputs. Add drive time, stocking time, counting time, and service time so route economics reflect the real work behind each stop.
- Separate routine service from exception service. Note likely repairs, payment issues, and machine downtime so your assumptions include a maintenance reserve.
- Record every assumption with a source. Use site visits, vendor quotes, comparable routes, and host discussions so the model can be updated when reality changes.
Once these route and territory inputs are documented, the next step is to translate them into sales, margin, and working-capital scenarios so you can compare locations, equipment choices, and launch sequencing more clearly.
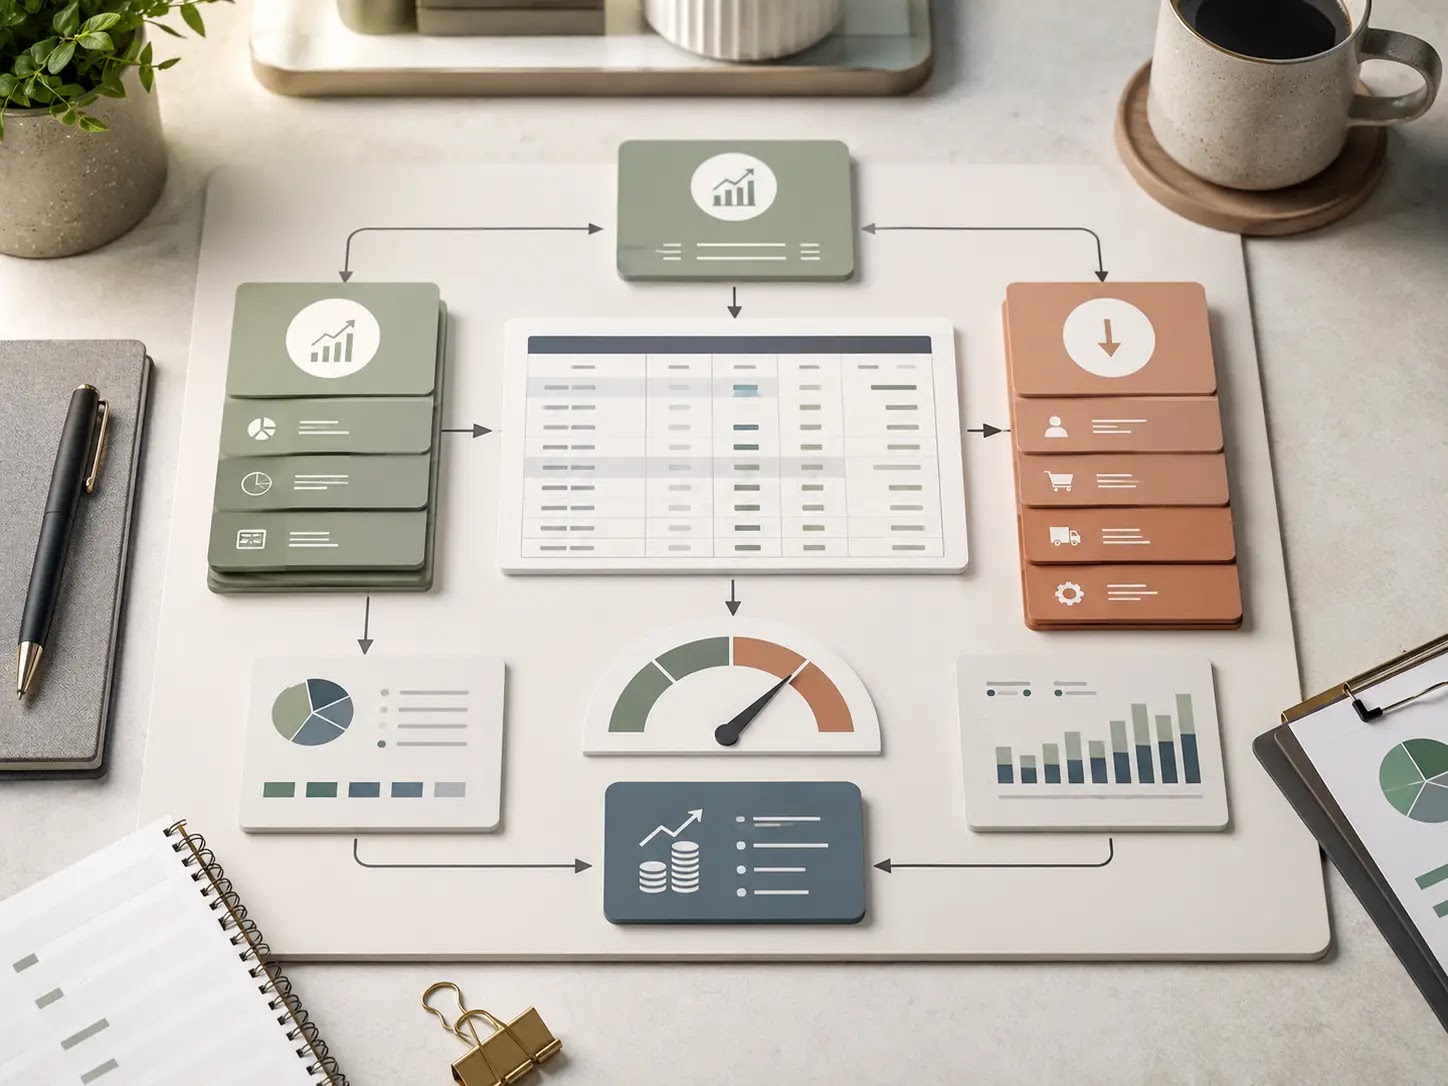
How should the financial model handle margin risk and local verification?
For vending routes, margin assumptions can shift quickly when commission terms, machine downtime, travel distance, and product mix change. A location that looks attractive on paper can still strain cash if it takes more labor, more mileage, or more repair spending to keep it supplied. Build the model from verified local inputs, not generic averages.
Route density risk
Long gaps between stops usually increase fuel, windshield time, and labor per dollar of sales.
Commission and placement risk
Higher location share can make access easier, but it reduces retained gross margin and raises break-even sales needs.
Downtime and repair risk
Repairs, parts, and failed machines can force extra service trips and create inventory waste or missed revenue.
Planning calculator: what should the model sum first?
| Planning output | Simple formula logic | Inputs to collect | Model impact |
|---|---|---|---|
| Startup cash required | Machine acquisition or lease setup + transport/install + opening inventory + software/setup + contingency | Verified vendor quotes, deposit requirements, install costs, and opening stock order size | Sets the launch funding target and the minimum cash buffer |
| Monthly operating cash need | Route labor + mileage/fuel + commissions + repairs/parts + software + spoilage/shrink + admin + debt service | Route map, service cadence, wage assumptions, commission terms, and recurring vendor bills | Drives break-even sales, runway, and lender readiness |
| Break-even sales target | Fixed monthly costs ÷ contribution margin rate | Verified product mix, average selling price, product cost, commissions, and service burden | Shows how much sales volume is needed before the route supports itself |
| Cash runway | Starting cash ÷ monthly operating cash need | Opening cash, reserve policy, and expected ramp period | Shows how long the business can absorb slower-than-planned sales or repair events |
| Funding need | Startup cash required + early operating reserve - owner injection | Launch budget, reserve target, and available equity capital | Useful for lender conversations and pitch-deck readiness |
Which assumptions usually move the numbers the most?
| Assumption | Downside movement | Likely model effect | What to revisit |
|---|---|---|---|
| Route mileage | Stops are farther apart than expected | Higher fuel, labor, and service time per machine | Territory density and stop clustering |
| Location commission | Landlord or host asks for a larger share | Lower retained gross margin | Break-even sales and location screening |
| Product mix | Higher share of lower-margin items | Contribution margin falls even if unit volume holds | Price points, pack sizes, and category mix |
| Repair frequency | More service calls or parts replacement | Higher downtime and extra truck rolls | Maintenance reserve and machine quality assumptions |
Local verification warning
Numbers vary by market and must be replaced with current quotes, local requirements, and verified data. Check location agreements, commission terms, utility access, route travel time, machine pricing, supplier terms, payment processing costs, insurance expectations, and any local permit or operating requirements with current local sources before you finalize the model.
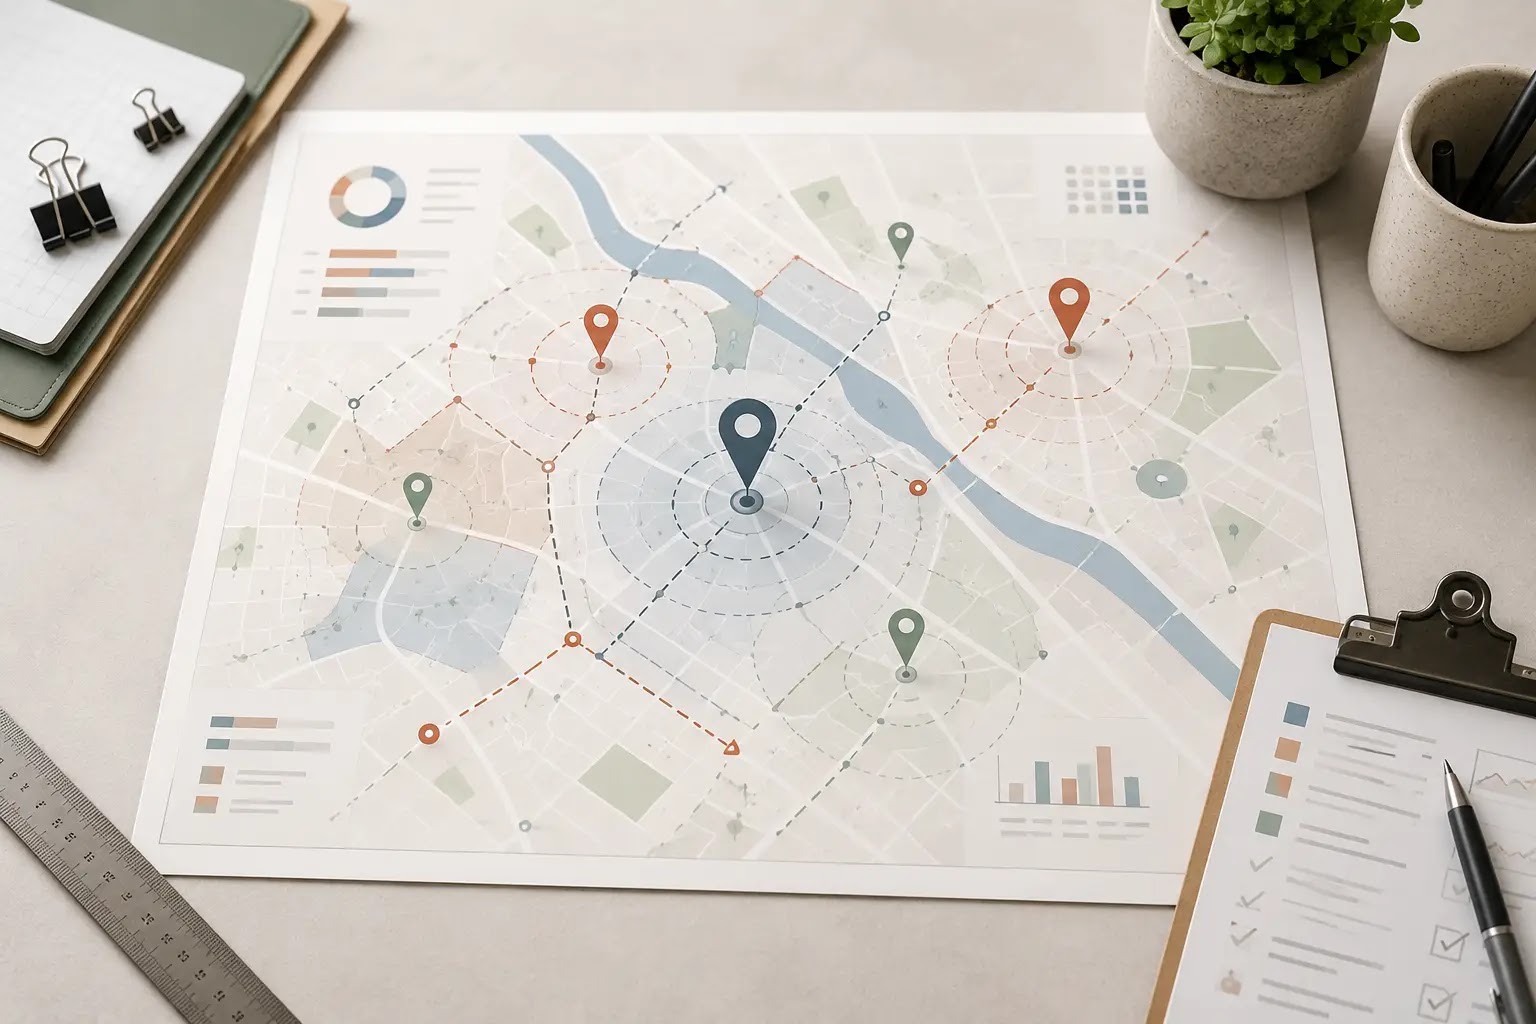
What should you do next before you buy, fund, or launch a vending route?
Practical recap: better margins usually come from route density, predictable back-of-house access, disciplined inventory handling, and tight control over mileage, repairs, commissions, software, and working capital. Before you commit, verify whether the route can support the travel pattern, service frequency, and cash needs your model assumes. If the route only works at a narrow volume level, the margin plan is fragile.
Readiness scorecard
| Readiness check | What to confirm | Why it matters |
|---|---|---|
| Route density | Machines are clustered enough to keep drive time and service time under control. | Low density can erode margin even when sales per machine look acceptable. |
| Back-of-house access | Delivery windows, loading rules, and restock access are workable for your schedule. | Poor access raises labor time, delay risk, and missed service visits. |
| Inventory plan | Product mix, reorder timing, and storage space match expected demand. | Weak inventory planning ties up cash and increases stockout risk. |
| Repair exposure | You have a realistic allowance for service calls, parts, and replacement timing. | Maintenance surprises can quickly reduce route cash flow. |
| Working capital | You can cover inventory, fuel, commissions, software, and early operating gaps. | Even a promising route can strain cash before it stabilizes. |
Next planning steps
- Confirm the actual machine count, locations, and service frequency for the route.
- Verify mileage, drive time, and back-of-house access for each stop.
- List the inventory inputs, repair needs, commissions, software, and fuel assumptions used in the model.
- Test at least one downside case for lower sales, higher service time, or higher replacement cost.
- Check current vendor terms, lease or placement terms, and local operating requirements with up-to-date sources.
- Make sure the launch budget includes enough working capital to survive the first operating stretch.
Useful bridge: a business plan, financial model, pitch deck, checklist, and startup toolkit can help organize assumptions, compare route scenarios, and document the plan for partners, lenders, landlords, or advisors. Use them to make the decision concrete before you sign or scale.


