
Vending Machine Capacity Planning: How Many machine or location Can You Sell?
A practical U.S. planning guide for vending machine capacity planning: how many machine or location can you sell?, built for founders, buyers, and operators comparing assumptions before committing capital.

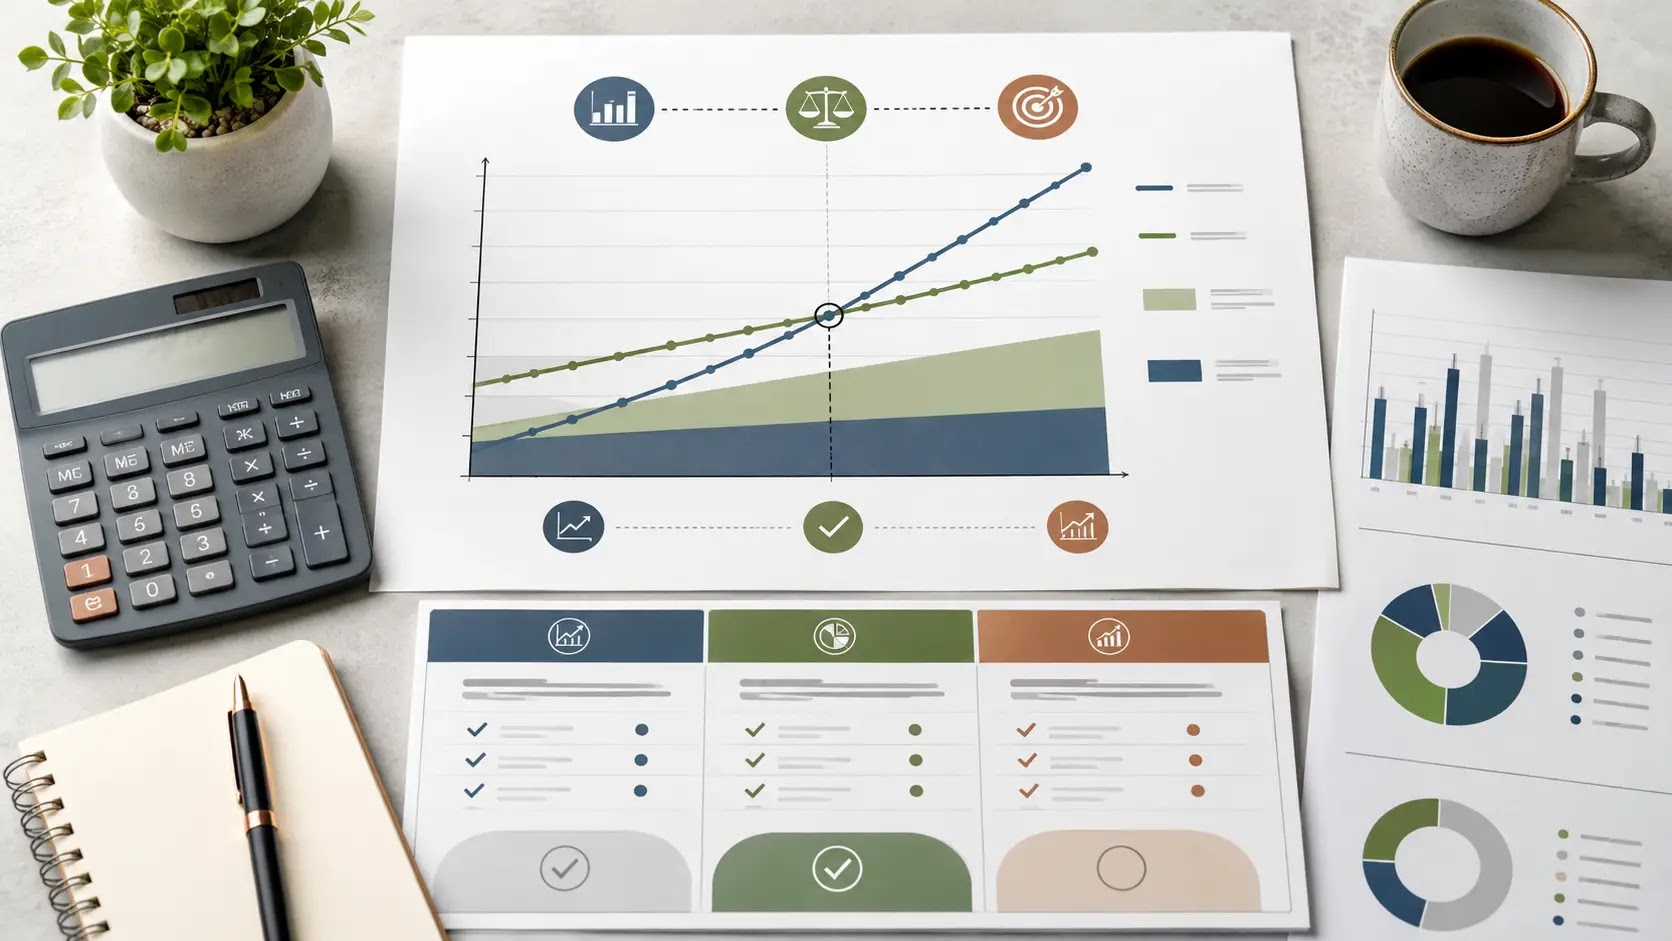
How many vending machines or locations can you realistically sell, operate, and support?
If you are deciding how many vending machines or locations to buy, place, or build into a route, the practical answer is: it depends less on the machine count itself and more on how much service time each location requires. A route with tight geography, simple product mix, reliable equipment, and low restocking friction can support more units than a scattered route with frequent repairs, cash handling, and difficult access.
For founders and buyers, capacity planning should start with operating load, not just sales potential. The key question is whether the route can be serviced with the labor, vehicle time, inventory cash, repair coverage, and manager attention you actually have available. That is what determines whether added machines improve earnings or just add complexity.
Quick decision snapshot
| What the reader is deciding | How many machines or locations can be added without breaking route efficiency, cash flow, or service quality. |
|---|---|
| What must be verified locally | Location terms, commission structure, access hours, product mix, route mileage, labor availability, repair costs, and working capital needs. |
The most useful way to think about capacity is as a tradeoff between revenue per stop and the hidden costs of serving each stop. A strong location may justify more visits, a broader assortment, or higher inventory, while a weaker one may only work if it is close to other stops and inexpensive to service. If you are preparing a lender conversation, acquisition model, or pitch deck, document those assumptions clearly before you scale the route.
- Lease or location terms that affect access, rent, revenue share, and service windows.
- Equipment condition, age, and repair exposure for each machine type.
- Labor time for stocking, cleaning, collecting, and troubleshooting.
- Menu economics, including product mix, spoilage risk, and refill frequency.
- Permits and local operating requirements that may change the plan.
- Working capital for inventory, fuel, maintenance, and slow-pay periods.
- Funding readiness if the route must support a purchase, buildout, or expansion.
Next, the practical framework breaks those assumptions into a simple planning method so you can estimate route capacity with fewer guesswork gaps.
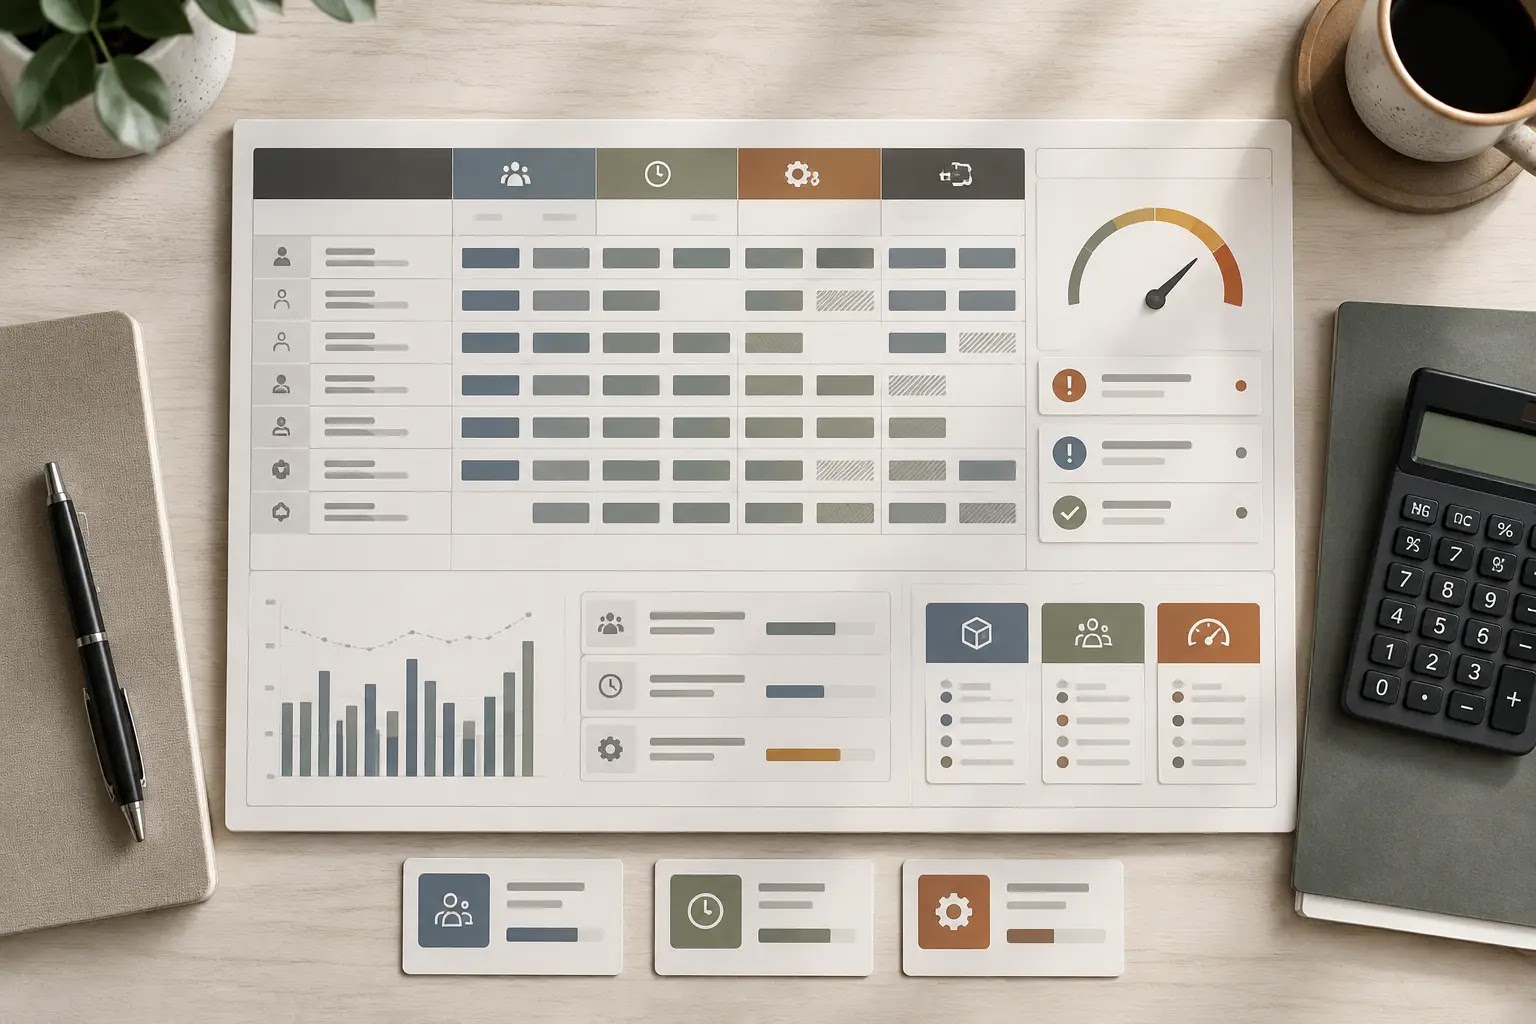
What should a vending capacity plan actually measure?
A useful capacity plan does not start with “how many machines can I own?” It starts with how many machines or locations your route can support after you account for service time, refill frequency, travel, commissions, downtime, inventory turns, and cash tied up in stock.
Planning frame: route and unit economics first
For a U.S. vending business, capacity is usually constrained by the economics of each stop and the operator’s ability to service them consistently. A machine that looks attractive on paper can become a weak asset if it needs frequent refills, is far from the rest of the route, or sits in a location with terms that reduce margin.
Use the framework below to document the assumptions that matter before you estimate how many machines or locations one operator, truck, or route can realistically support.
| Planning area | Question to answer | Input to collect | Model impact | Verification source |
|---|---|---|---|---|
| Location demand | Does the stop generate enough sales to justify regular service? | Observed sales by machine, customer traffic pattern, product mix, seasonality | Revenue per machine, refill frequency, and break-even timing | Existing sales reports, site visit, manager interviews, POS or cash logs |
| Service frequency | How often must the machine be restocked or maintained? | Units sold per week, shelf capacity, spoilage risk, maintenance history | Labor hours, route density, truck mileage, inventory turnover | Historical service records, field checks, vendor notes |
| Route density | How clustered are the stops? | Map of locations, drive time between stops, access windows, parking constraints | Stops per day, fuel cost, route productivity, operator capacity | Route map, GPS review, on-site timing test |
| Commission and location terms | What share of gross sales is retained at the site? | Commission structure, rent, minimum guarantees, term length, exclusivity, renewal risk | Net margin per machine and sensitivity to sales volume | Lease or location agreement, operator contract, landlord communication |
| Inventory load | How much cash is tied up in stocked products? | Product cost, reorder cadence, par levels, shelf life, vendor lead times | Working capital need and cash conversion cycle | Supplier quotes, purchase orders, warehouse records |
| Machine uptime | How much revenue is lost when a machine is down? | Repair history, parts access, age of equipment, payment system reliability | Lost sales, service reserve, replacement timing | Maintenance logs, technician feedback, inspection records |
| Labor capacity | How many machines can the current team service without overtime or missed visits? | Route time, stocking time per stop, repair time, training level, backup coverage | Maximum manageable machine count per operator | Trial route run, time study, staffing plan |
| Payments and shrink | What friction or leakage affects collected revenue? | Cashless fee terms, cash collection process, theft exposure, spoilage, returns | Net revenue, reconciliation risk, audit controls | Processor terms, cash logs, inventory counts, loss reports |
How to turn site research into a documented capacity estimate
- Separate machines by type and service pattern. Snack, beverage, combo, and specialty machines often have different refill needs, product turns, and maintenance exposure.
- Measure each location as a unit, not as a generic stop. Record sales evidence, access hours, commission terms, nearby competition, and whether the site can support more than one machine.
- Build a route map with real travel time. Group stops by geography and note whether the route can be serviced on a single trip or requires multiple trips each week.
- Document restocking assumptions. Estimate how many machines can be serviced per day, then test that against load times, stocking time, cash collection, and maintenance follow-up.
- Translate sales into inventory and labor demand. Higher sales may improve revenue per machine, but they also increase stock purchases, refill frequency, and the chance of stockouts.
- Check the location economics before you scale count. A new machine only adds capacity if the site terms leave enough margin after commission, service, and product costs.
- Record the assumption source for each input. Distinguish between observed numbers, owner estimates, vendor quotes, and contract terms so the model can be updated later.
Capacity checklist for route-based planning
Confirm location-level sales evidence instead of relying on the seller’s summary alone.
Map service radius and route clustering so travel time is part of the capacity limit.
Estimate refill frequency by machine type and note which units require more labor.
Capture commission, rent, and minimums from actual location terms where available.
Test inventory cash needs for the number of machines you want to add, not just the number you can buy.
Track repair exposure and downtime risk for older or cashless-enabled machines.
Document staffing capacity so the route can be serviced with consistent frequency.
Once these inputs are documented, you can use them to test how many machines or locations the business can support under different operating assumptions. The next step is to convert those assumptions into financial model implications, tradeoffs, and risk checks.
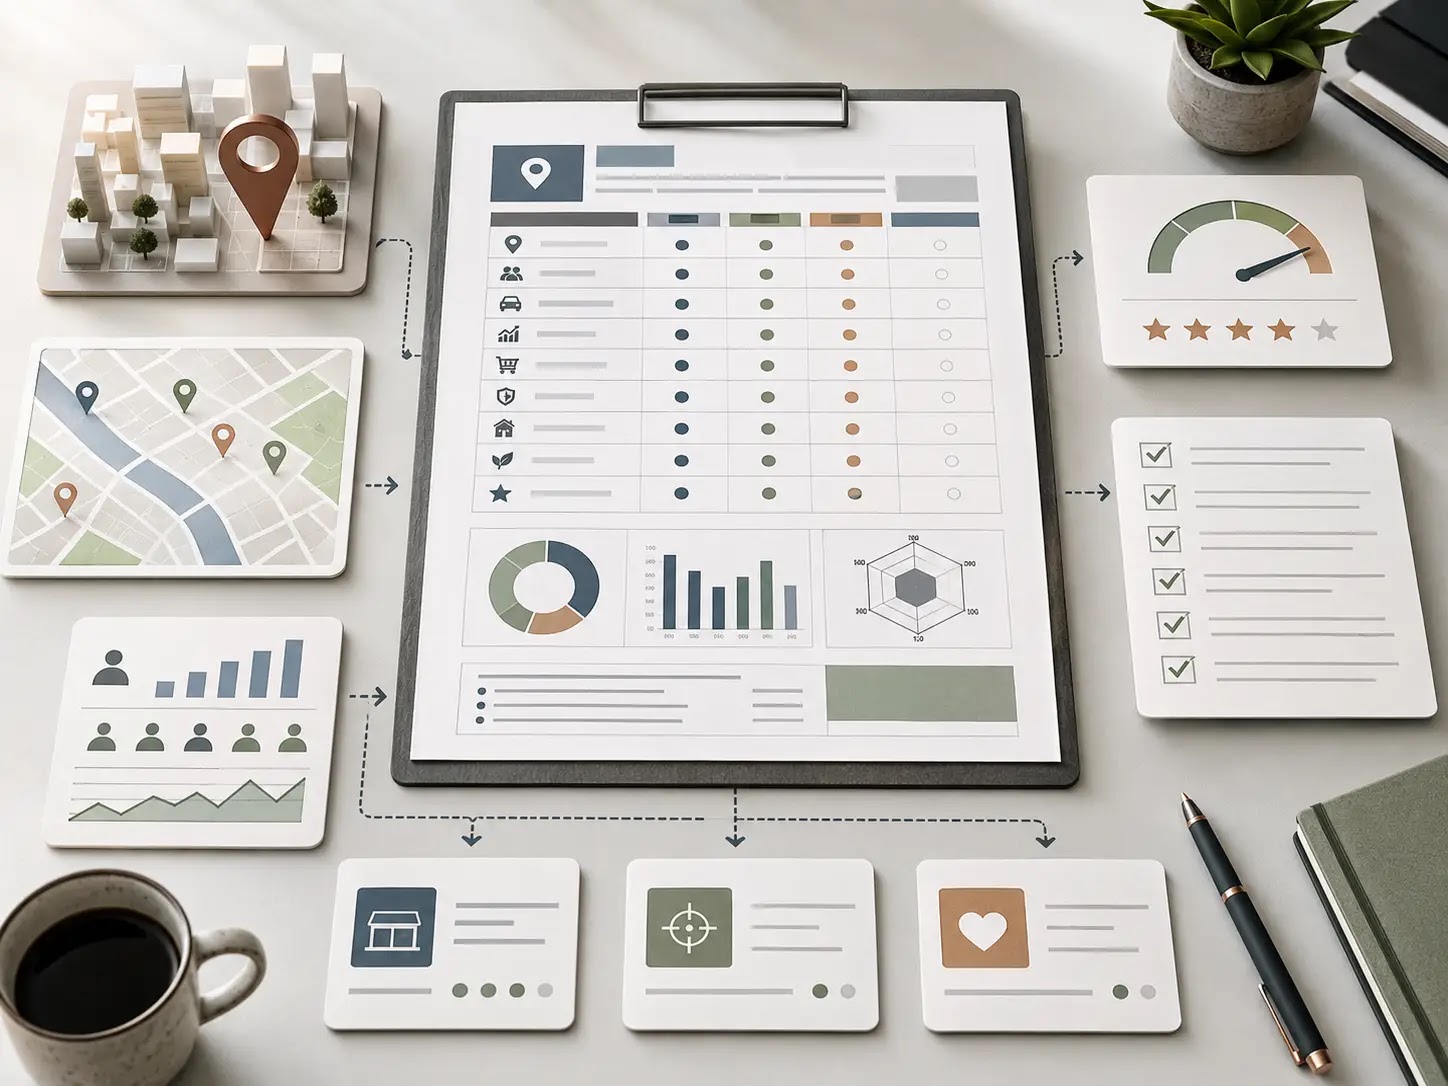
What changes the answer once you add route risk, commissions, and downtime?
For a vending machine business, “how many machines or locations can you sell?” is not just a sales question. It is a capacity question about service time, inventory turns, route mileage, machine uptime, and cash tied up in stock. A route that looks profitable on paper can become harder to scale if restocking takes longer than expected, product mix varies by stop, or repairs pull service time away from selling and placement work.
The key tradeoff is that more machines can mean more revenue opportunity, but only if the operator can keep locations stocked, serviced, and positioned in the right mix. Capacity is often constrained by the least flexible input: driver time, access hours, vendor lead times, commissions, or the owner’s ability to handle machine acquisition and location management at the same pace as growth.
So the answer changes by scenario. A compact route with high-traffic placements may support more machines per day of labor than a spread-out route with frequent special requests. A location with stronger sales may justify more inventory and tighter service intervals, while a lower-volume stop may still add complexity because it creates another stop, another agreement, and another chance for downtime. That is why the planning model should test both revenue per machine and operating burden per machine before you commit to expansion.
Which scaling scenario is most likely to break first?
Dense route, short drive times
Usually easier to scale, but only if restock cadence, product loading, and cash handling stay efficient.
Spread-out locations
Can add sales potential, but mileage, fuel, and time per stop may reduce owner earnings faster than expected.
Higher-commission placements
May win better locations, but the commission burden changes break-even and can limit how many machines remain attractive.
| Planning risk | Why it matters in vending | Assumption affected | How to verify |
|---|---|---|---|
| Route mileage is higher than planned | More drive time can reduce the number of machines one operator can service in a day. | Service time, fuel cost, and machine count per route | Map all stops, measure drive time between locations, and compare actual route density |
| Sales per machine vary widely by location | Some stops justify frequent restocking while others add overhead without enough volume. | Average revenue per machine and inventory turnover | Review location-level sales logs rather than using one blended average |
| Machine downtime or repair frequency is higher than expected | Broken equipment can create lost sales and extra service calls. | Uptime, maintenance reserve, and spare cash needs | Track repair history, parts lead times, and technician availability |
| Location commissions or access terms are less favorable | Payouts or restrictions can compress gross margin and limit expansion room. | Net margin per location | Review the actual agreement and compare it with current operating results |
| Inventory shrinkage or spoilage rises | Lost product can silently reduce earnings, especially when scale increases order size. | Inventory cost, waste rate, and working capital | Compare purchased inventory to sold inventory and reconcile shortages by stop |
| Software, payment, or cash handling costs change | Monitoring, telemetry, and payment processing can improve control but add recurring cost. | Operating expenses per machine | Confirm current vendor terms and compare them against route economics |
Verify local terms before you lock in the capacity target
Local rules, costs, vendor terms, lease terms, and financing conditions vary by market and should be checked with current local sources. For vending, that includes location agreements, property access rules, equipment pricing, payment processing terms, insurance requirements, and any market-specific constraints that affect machine count, service cadence, or working capital.
Before moving to the final checklist, use this section to stress-test your assumptions: if the route gets farther apart, if commissions rise, or if service takes longer than planned, does the business still support the number of machines you want to sell or acquire? The next step is to convert those answers into a simple go/no-go action list for launch or purchase.

What should you do next after estimating vending machine capacity?
If your capacity estimate still works after you stress-test route time, refill frequency, spoilage, commissions, repairs, software, and working capital, you have a usable planning number. If it breaks when you add those operating inputs, the real answer is usually fewer machines, slower growth, or a different location mix.
The decision path is simple: confirm the location economics, check whether one operator can service the route on a reliable schedule, and verify that the cash flow can support inventory, maintenance, and replacement costs before you expand or buy.
Readiness scorecard: are you actually ready to scale?
| Planning area | Ready when... | What to verify now |
|---|---|---|
| Location economics | Each site still makes sense after commissions and refill labor | Actual sales by machine or location, site terms, and any location-specific deductions |
| Route capacity | Service time and mileage fit your schedule without missed refills | Drive time, stop time, stocking frequency, and backup coverage |
| Working capital | You can fund inventory, repairs, and cash gaps during ramp-up | Starting cash needs, supplier terms, and reserve assumptions |
| Equipment reliability | Maintenance risk will not disrupt the route | Machine age, repair history, parts access, and technician options |
| Growth model | Adding more machines improves earnings instead of creating bottlenecks | Per-machine profit, route density, and whether a second route is needed |
Next planning steps for a U.S. vending founder or buyer
- Confirm your assumed revenue per machine or location using actual site data, not a generic average.
- Model refill labor, route mileage, spoilage, repairs, commissions, and software as separate inputs.
- Test whether the route still works if a few locations underperform or need more frequent service.
- Check inventory and reserve needs so growth does not create a short-term cash crunch.
- Compare a small-route scenario, a steady-growth scenario, and a scaled-route scenario.
- Verify any local lease terms, vendor terms, and market-specific operating requirements with current sources.
- Use the capacity number to decide whether to launch, buy, refinance, or hold off until the route improves.
Final takeaway: For a vending machine business, the right capacity number is the one that still works after route time, inventory, maintenance, commissions, and working capital are built in.


